33
/
AIzaSyB4mHJ5NPEv-XzF7P6NDYXjlkCWaeKw5bc
November 30, 2025
173991
Lao PDR
LAO
true
2
1
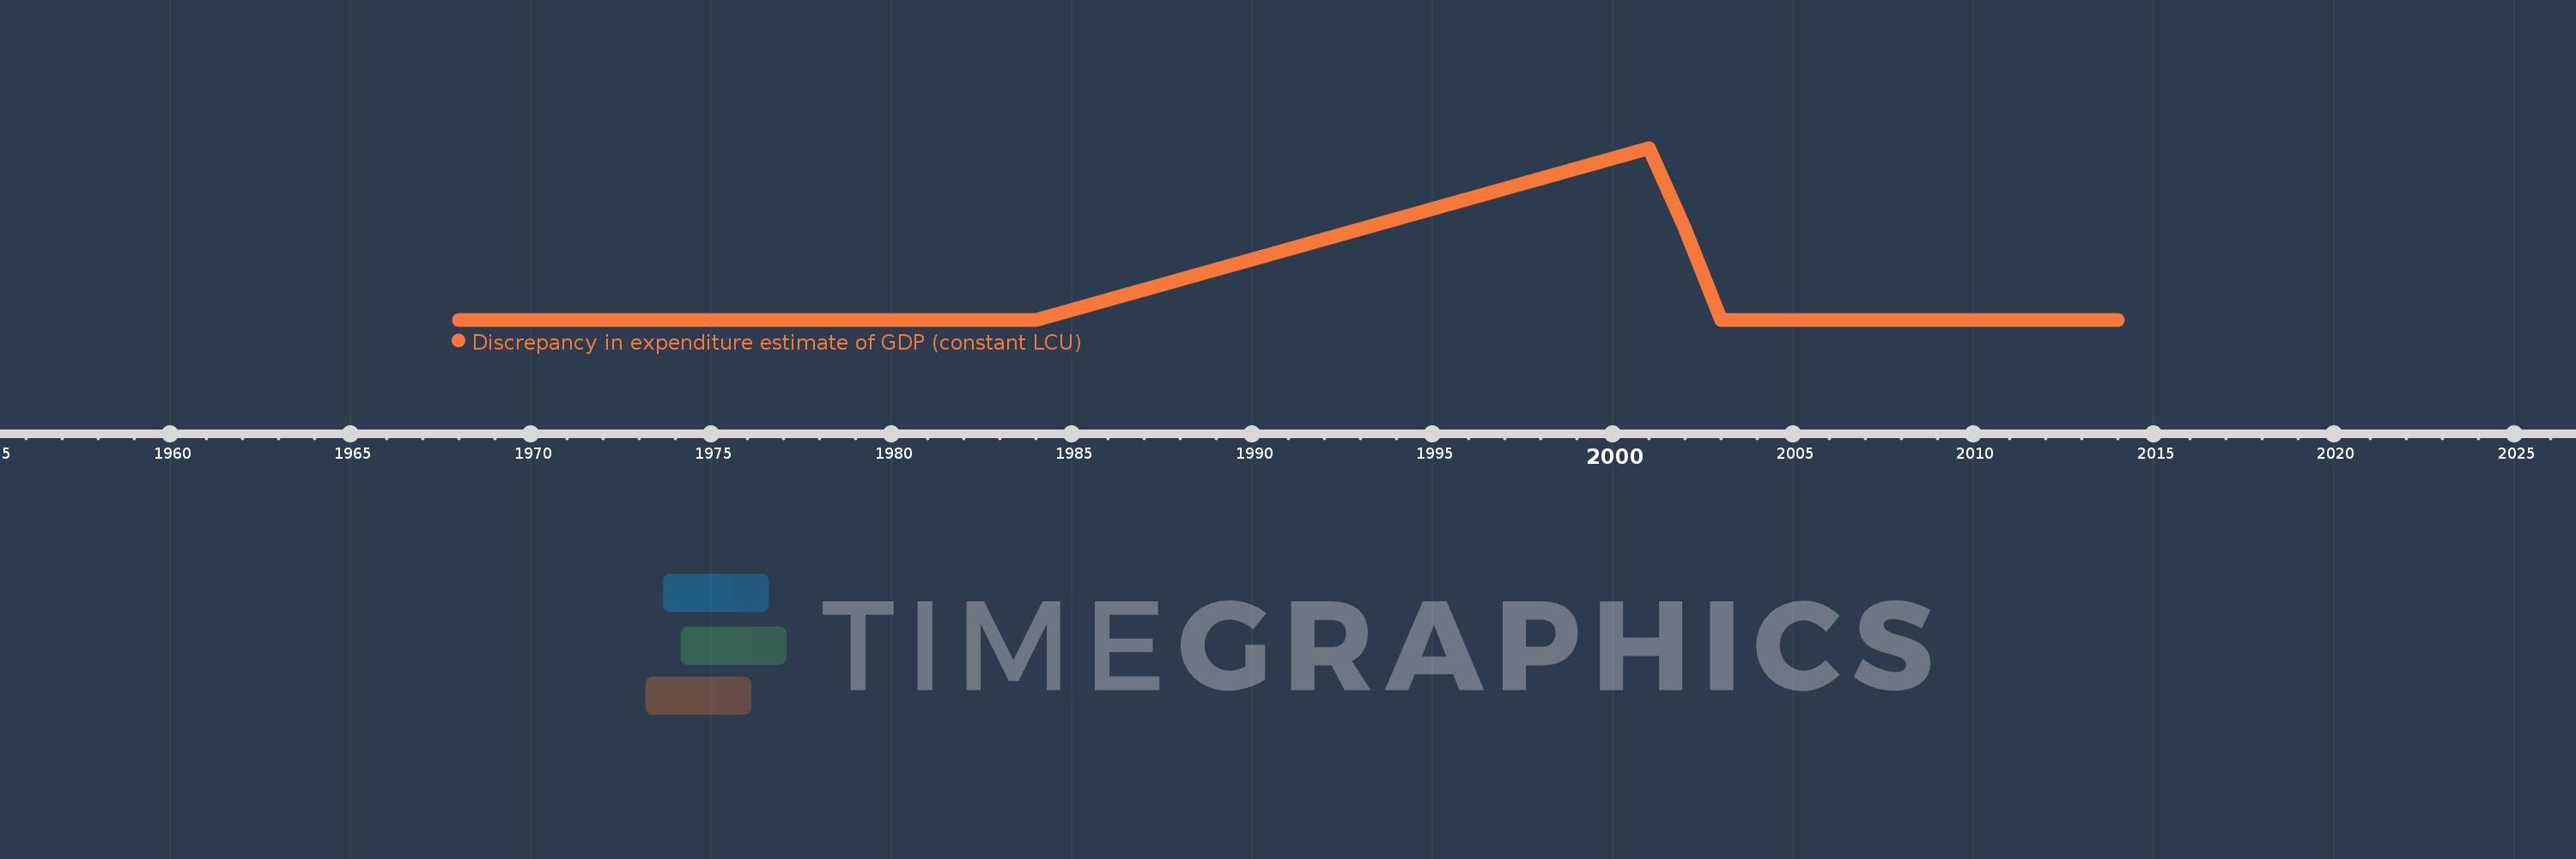
Discrepancy in expenditure estimate of GDP (constant LCU)
2014,2013,2009,2008,2006,2005,2004,2003,2002,2001,1984,1983,1982,1981,1980,1979,1978,1977,1976,1975,1974,1973,1972,1971,1970,1969,1968