Download This statistics in other country:
Timeline:
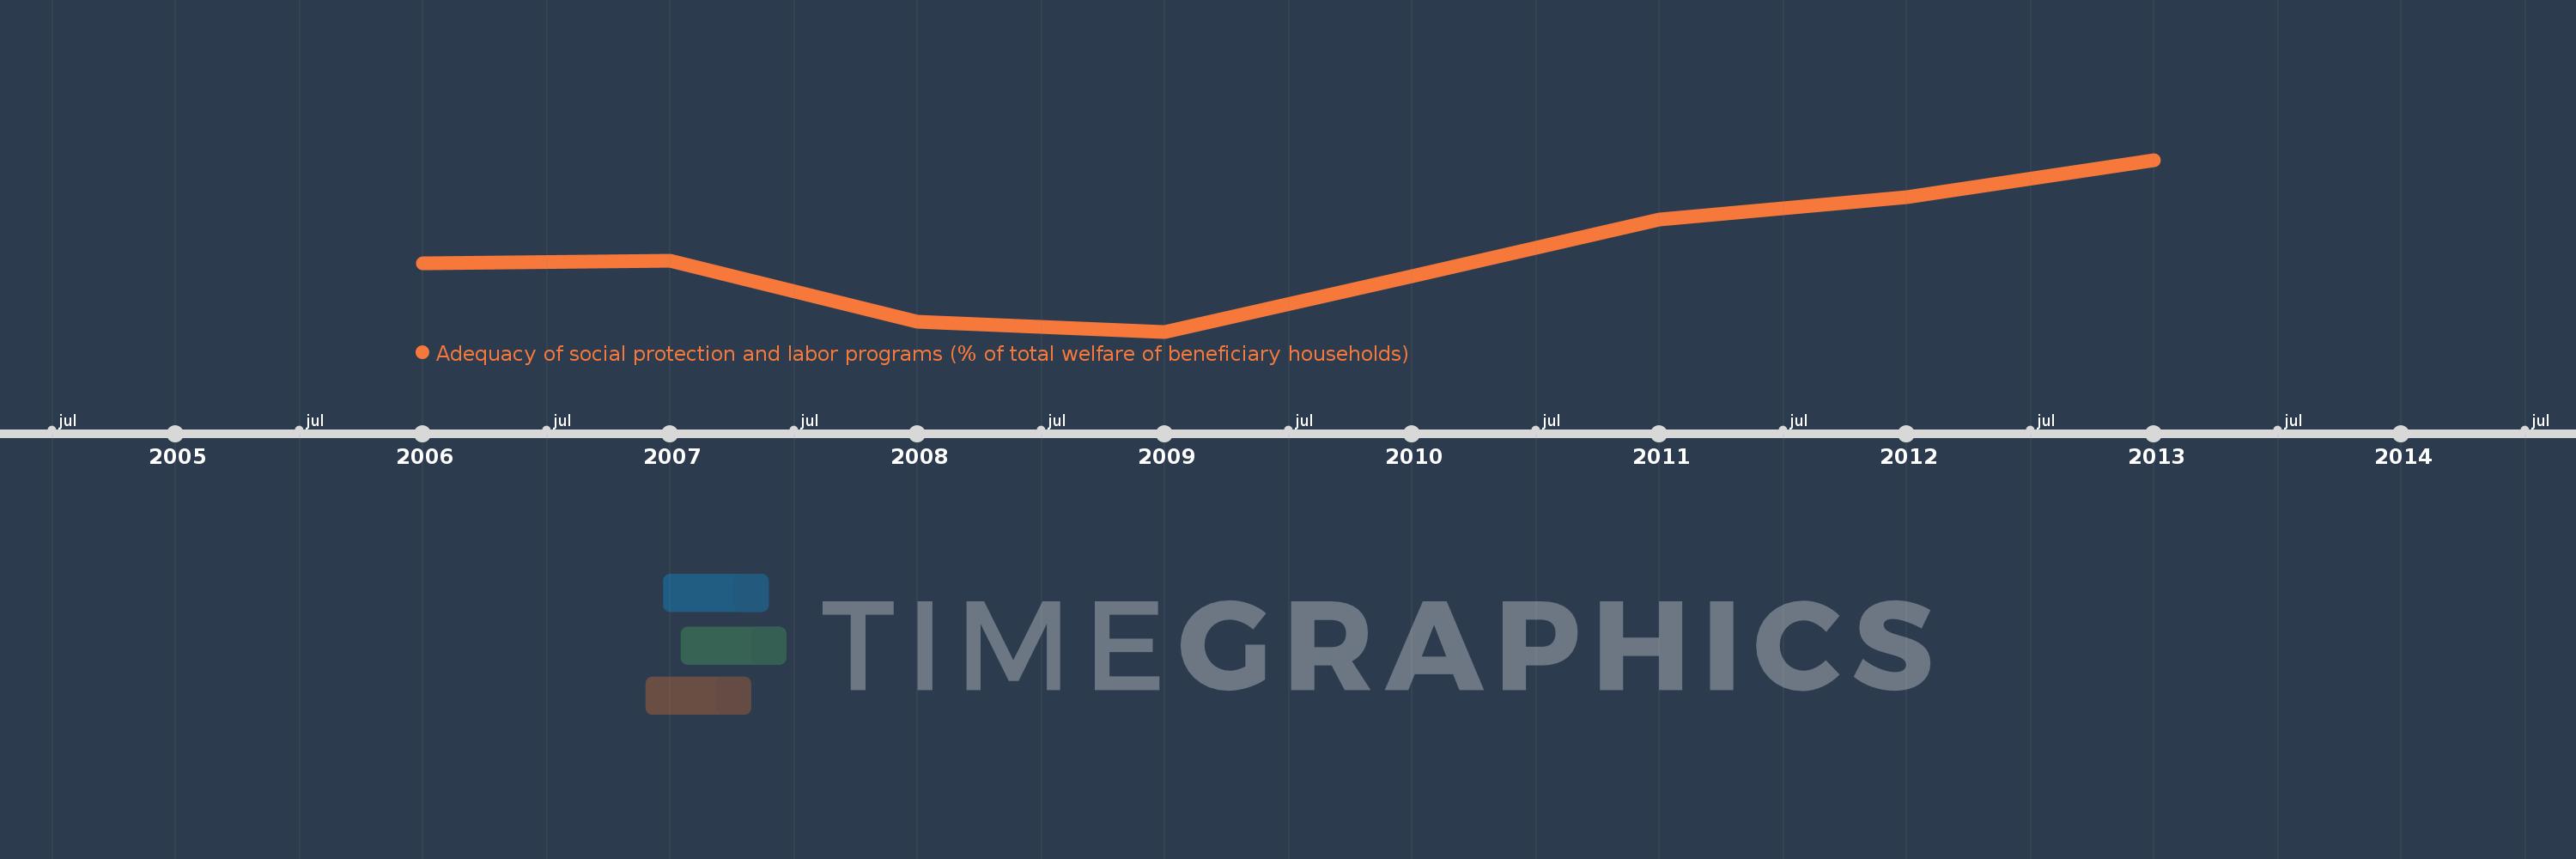
This timeline shows a graph from 2006 to 2013 of Poland. No data until 2005. Number of actual observations by date: 8.
Source name:
World Development Indicators
Source organization:
The Atlas of Social Protection: Indicators of Resilience and Equity (ASPIRE)
Categories, topics:
Social Protection & Labor
Last updated:
apr 23, 2017
Indicators value changes by year
Minimum:
54.653
jan 1, 2009
Maximum:
60.555
jan 1, 2013
At the date of observation
Value
Absolute change
Change from the previous value
jan 1, 2006
56.986
+56.986
0.0%
jan 1, 2007
57.087
+0.101
0.18%
jan 1, 2008
54.999
-2.087
-3.66%
jan 1, 2009
54.653
-0.346
-0.63%
jan 1, 2010
56.565
+1.912
3.5%
jan 1, 2011
58.51
+1.945
3.44%
jan 1, 2012
59.282
+0.773
1.32%
jan 1, 2013
60.555
+1.273
2.15%
Ranking of countries by current statistics by years