Download This statistics in other country:
Timeline:
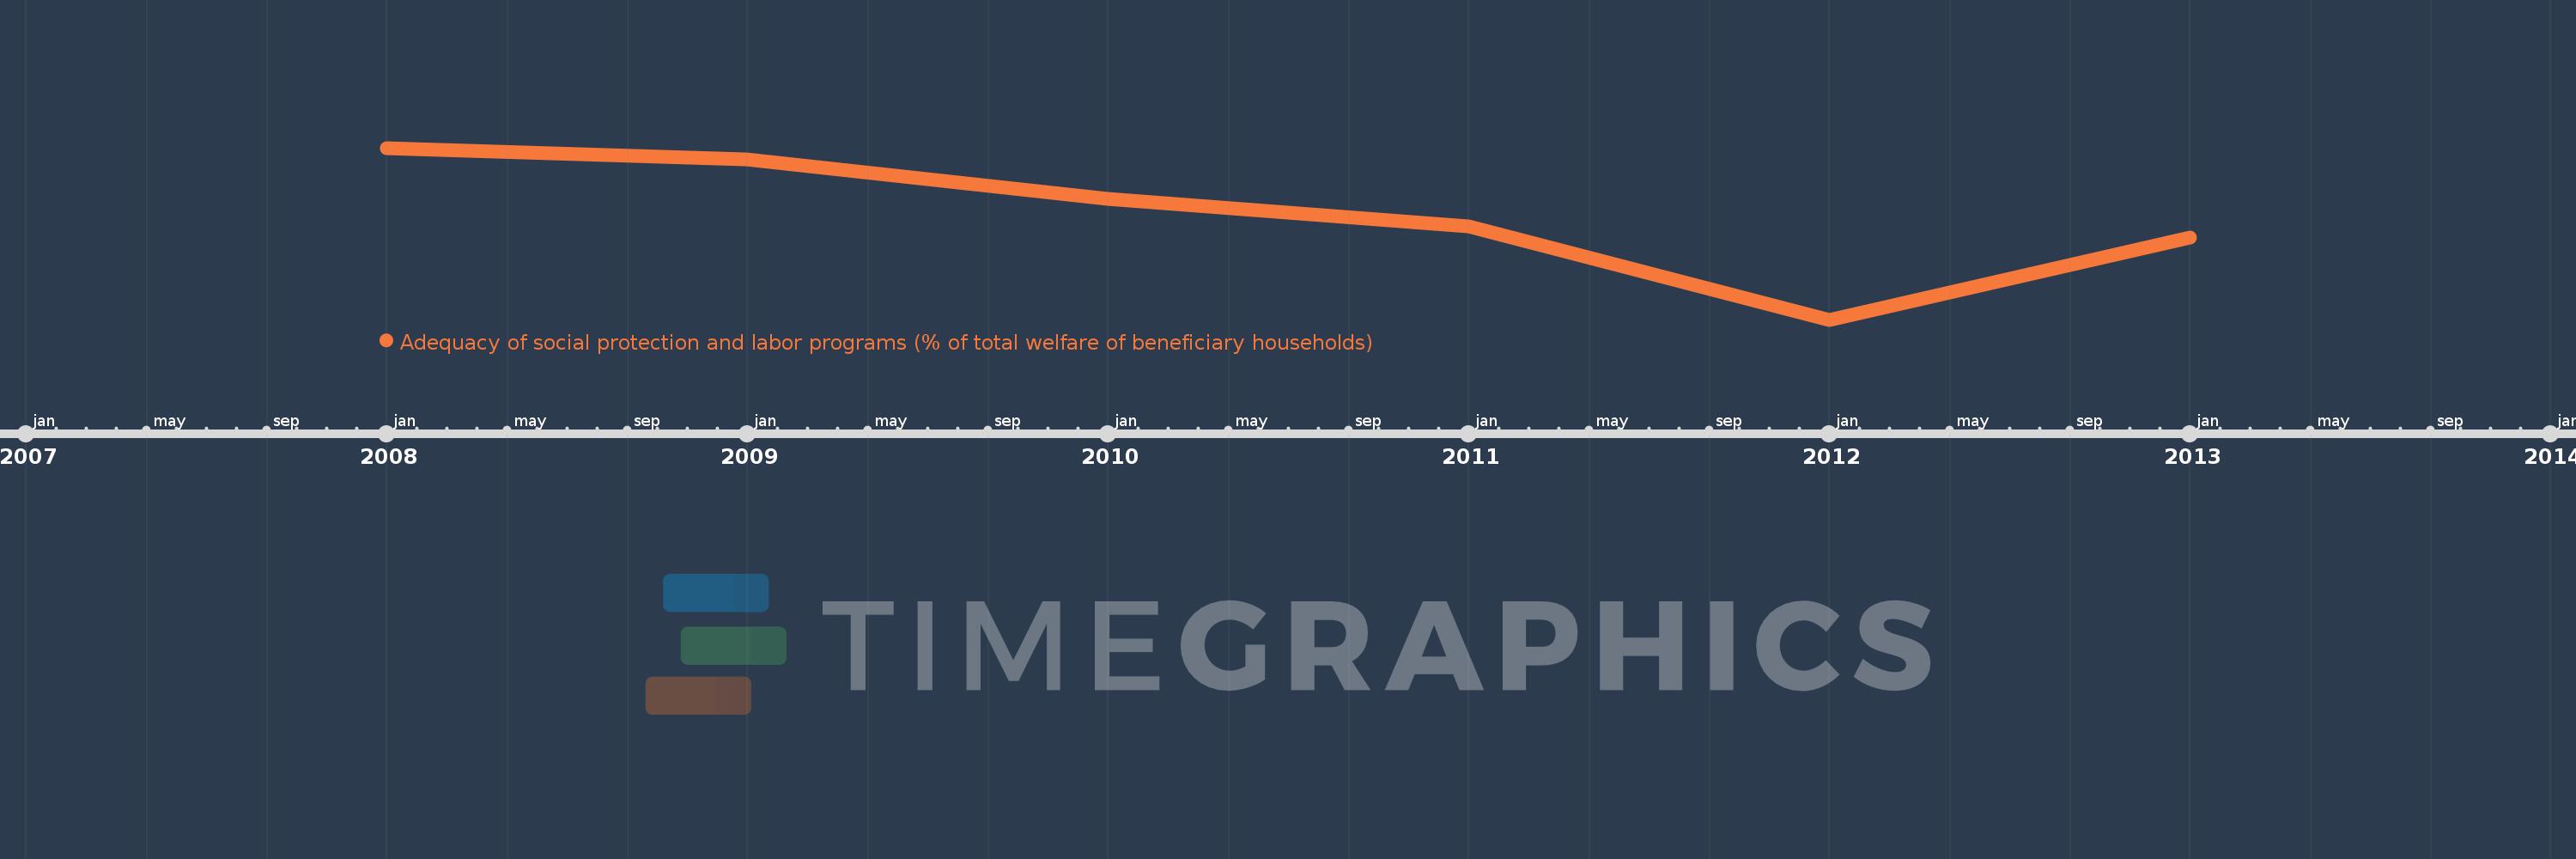
This timeline shows a graph from 2008 to 2013 of El Salvador. No data until 2007. Number of actual observations by date: 6.
Source name:
World Development Indicators
Source organization:
The Atlas of Social Protection: Indicators of Resilience and Equity (ASPIRE)
Categories, topics:
Social Protection & Labor
Last updated:
apr 23, 2017
Indicators value changes by year
Minimum:
24.054
jan 1, 2012
Maximum:
28.676
jan 1, 2008
At the date of observation
Value
Absolute change
Change from the previous value
jan 1, 2008
28.676
+28.676
0.0%
jan 1, 2009
28.368
-0.309
-1.08%
jan 1, 2010
27.311
-1.056
-3.72%
jan 1, 2011
26.564
-0.747
-2.74%
jan 1, 2012
24.054
-2.51
-9.45%
jan 1, 2013
26.269
+2.215
9.21%
Ranking of countries by current statistics by years