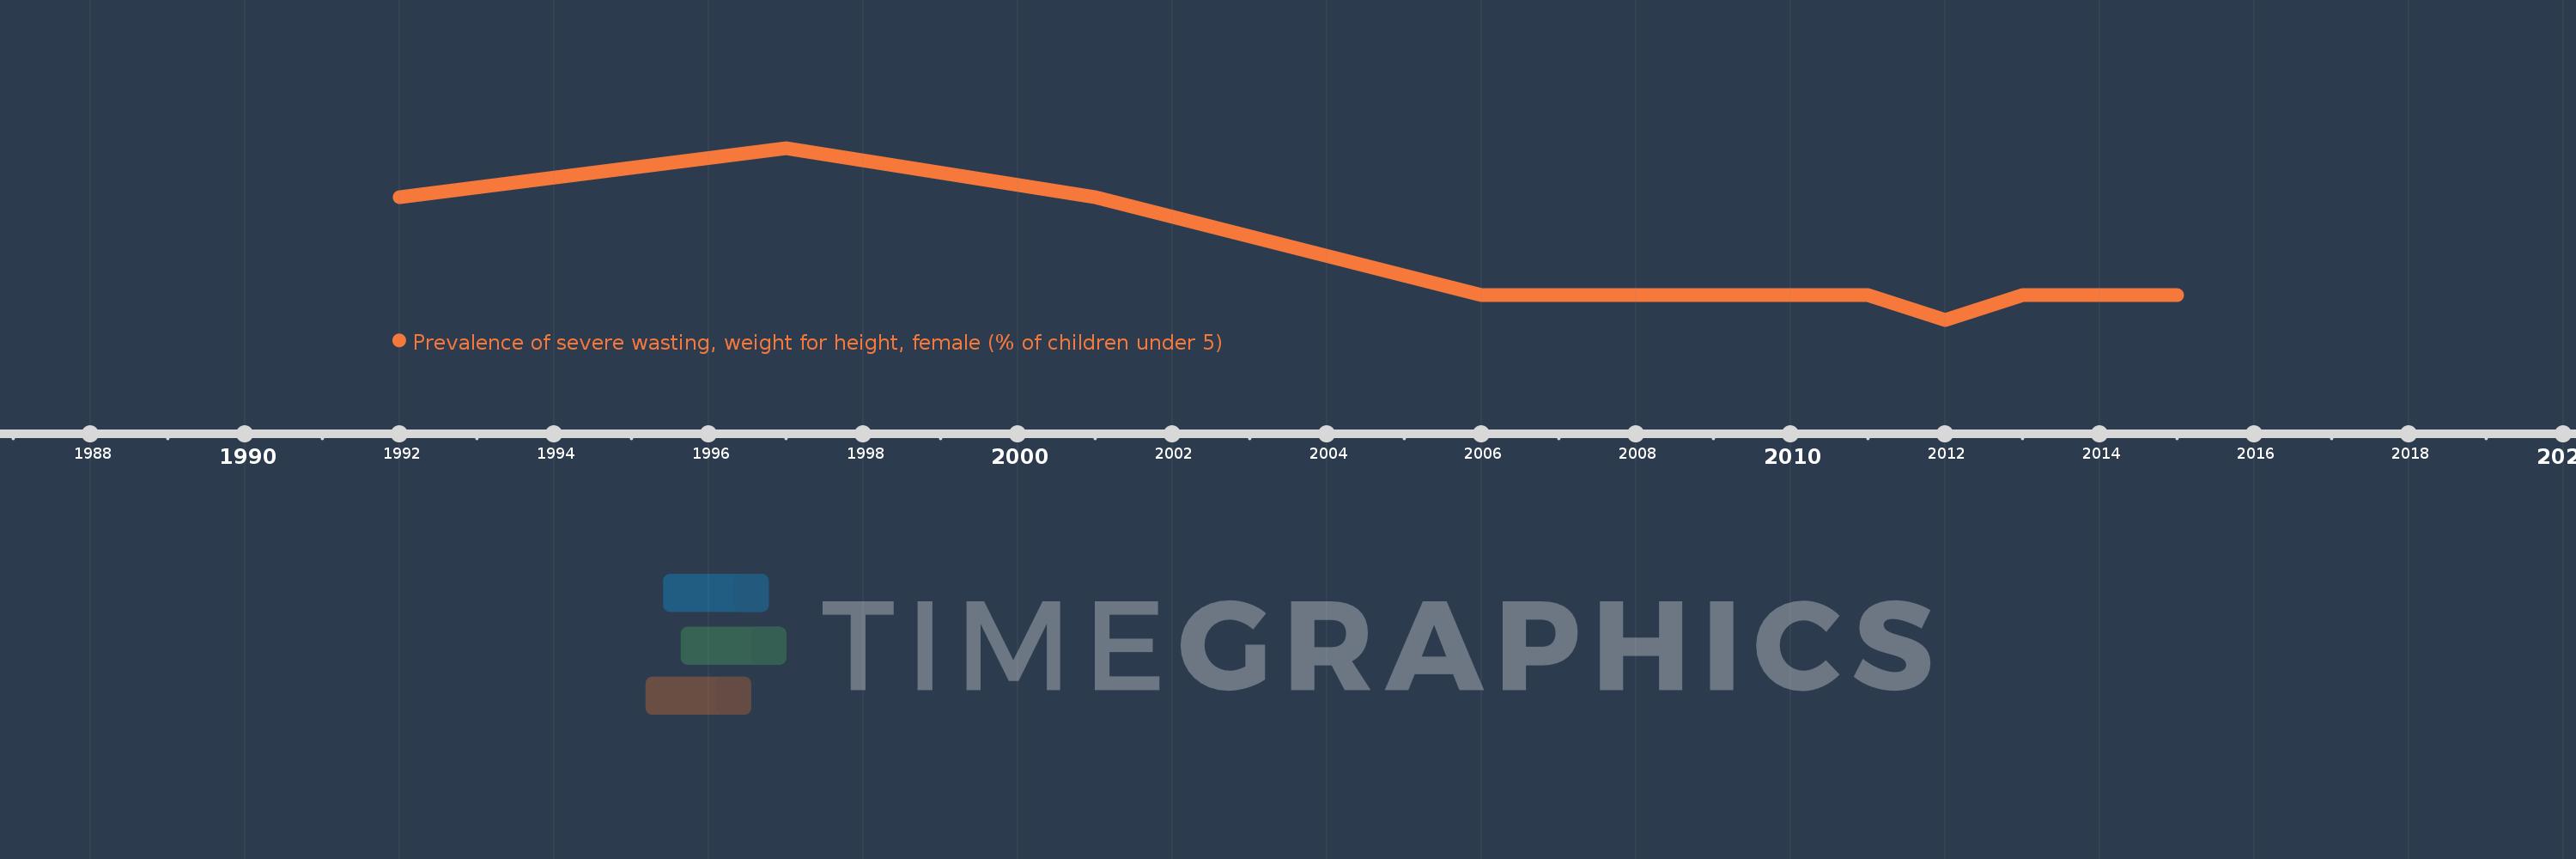
This timeline shows a graph from 1992 to 2015 of Peru. No data until 1991. Number of actual observations by date: 10.
Source name:
World Development Indicators
Source organization:
World Health Organization, Global Database on Child Growth and Malnutrition. Country-level data are unadjusted data from national surveys, and thus may not be comparable across countries.
Categories, topics:
Health
Last updated:
apr 23, 2017
Indicators value changes by year
Meaning:
0.23
Minimum:
0.0
jan 1, 2012
Maximum:
0.7
jan 1, 1997
At the date of observation
Value
Absolute change
Change from the previous value
jan 1, 1992
0.5
+0.5
0.0%
jan 1, 1997
0.7
+0.2
40.0%
jan 1, 2001
0.5
-0.2
-28.57%
jan 1, 2006
0.1
-0.4
-80.0%
jan 1, 2009
0.1
0.0
0.0%
jan 1, 2010
0.1
0.0
0.0%
jan 1, 2011
0.1
0.0
0.0%
jan 1, 2012
0.0
-0.1
-100.0%
jan 1, 2013
0.1
+0.1
%
jan 1, 2015
0.1
0.0
0.0%
Ranking of countries by current statistics by years