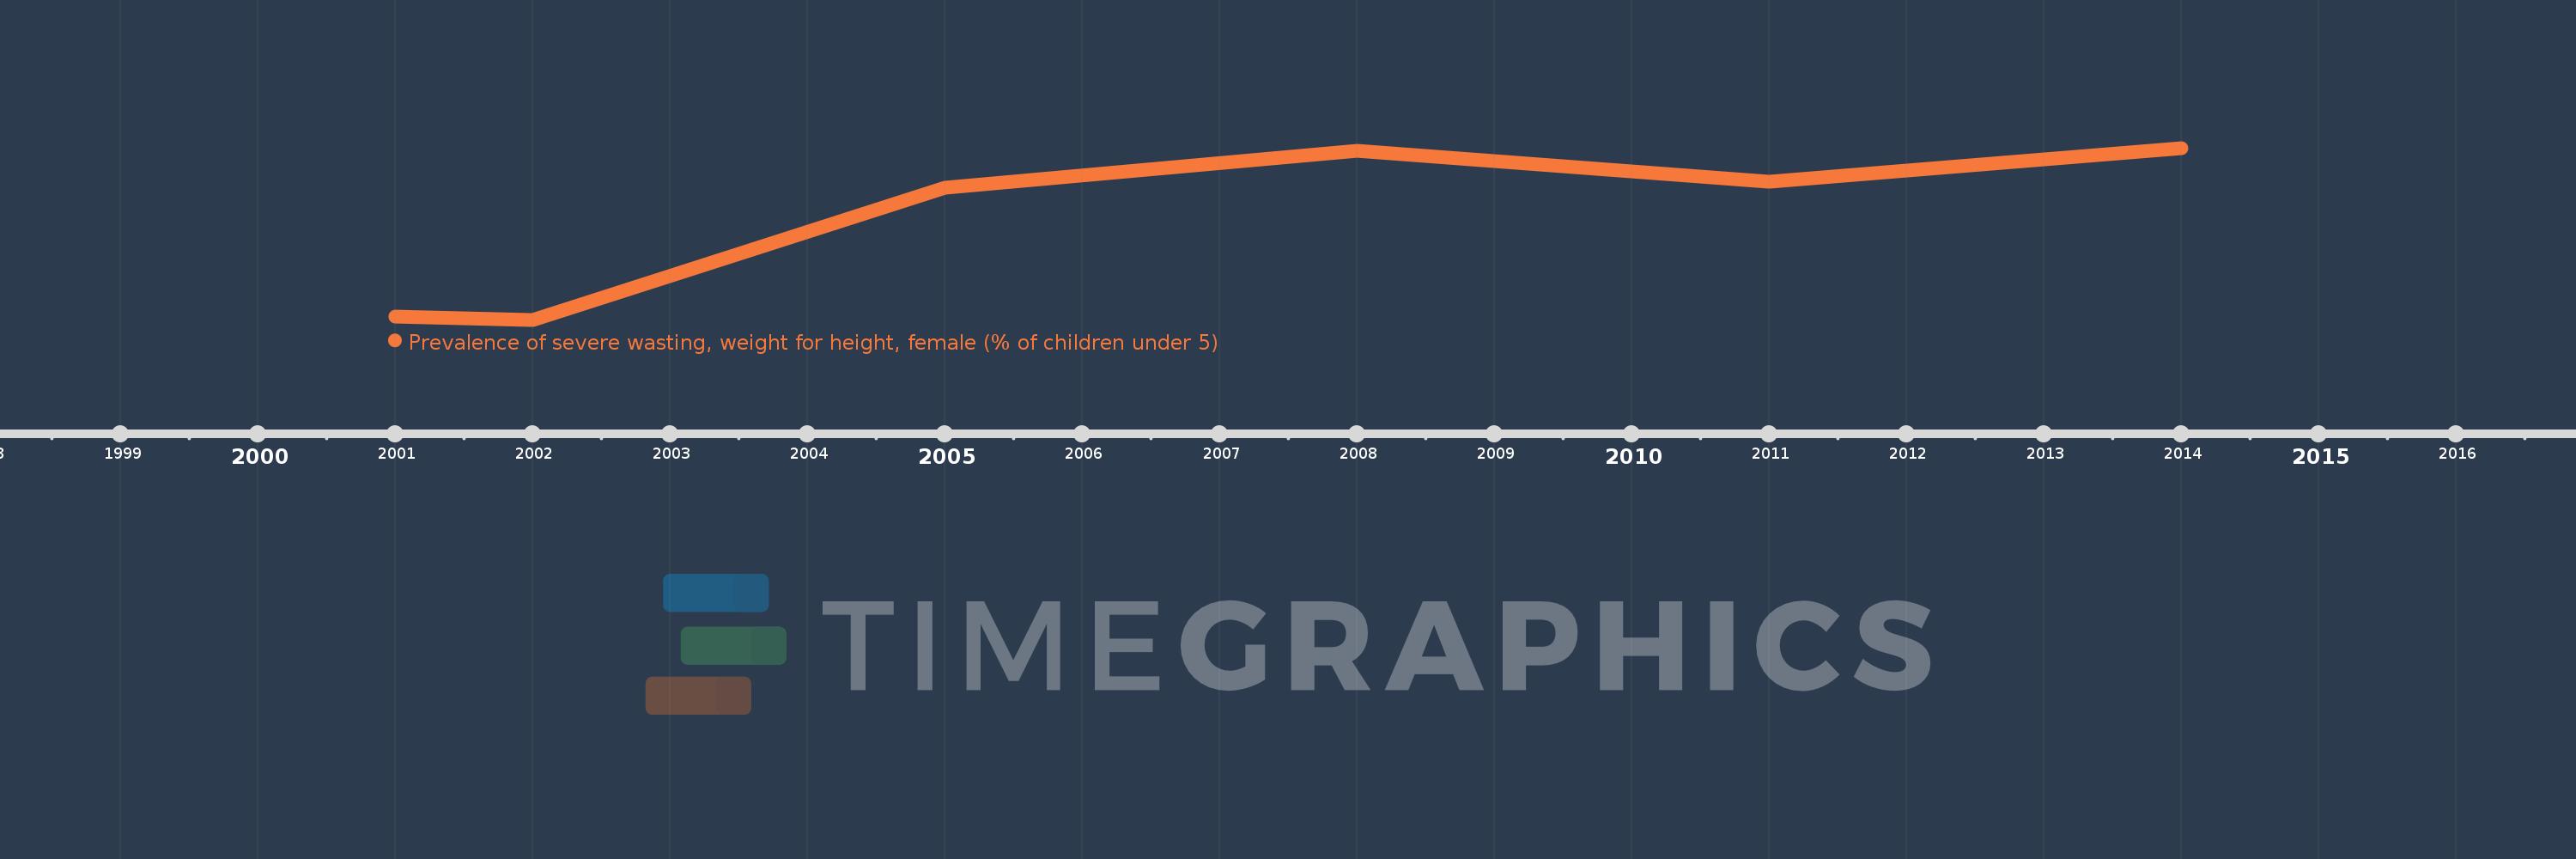
This timeline shows a graph from 2001 to 2014 of Indonesia. No data until 2000. Number of actual observations by date: 6.
Source name:
World Development Indicators
Source organization:
World Health Organization, Global Database on Child Growth and Malnutrition. Country-level data are unadjusted data from national surveys, and thus may not be comparable across countries.
Categories, topics:
Health
Last updated:
apr 23, 2017
Indicators value changes by year
Meaning:
3.933
Minimum:
0.6
jan 1, 2002
Maximum:
6.2
jan 1, 2014
At the date of observation
Value
Absolute change
Change from the previous value
jan 1, 2001
0.7
+0.7
0.0%
jan 1, 2002
0.6
-0.1
-14.29%
jan 1, 2005
4.9
+4.3
716.67%
jan 1, 2008
6.1
+1.2
24.49%
jan 1, 2011
5.1
-1.0
-16.39%
jan 1, 2014
6.2
+1.1
21.57%
Ranking of countries by current statistics by years