33
/
AIzaSyB4mHJ5NPEv-XzF7P6NDYXjlkCWaeKw5bc
November 30, 2025
220063
Papua New Guinea
PNG
true
2
1
PPG, bonds (NFL, current US$)
1996,1995,1994,1993,1992,1990,1989,1988,1987,1986,1985,1984,1983,1982,1981,1980,1979,1978,1977,1976,1975,1974
Create a timeline
Public Timelines
For education
For educational institutions
For teachers
For students
Cabinet
For educational institutions
For teachers
For students
Open cabinet
FAQ
Close
Create a timeline
Public timelines
FAQ
About & Feedback
Terms
Privacy
FAQ
Support 24/7
Cabinet
Get premium
Donate
Download
Global statistics library
→
Papua New Guinea
→
PPG, bonds (NFL, current US$)
This statistics in other country:
Albania
Algeria
Angola
Argentina
Armenia
Azerbaijan
Belarus
Belize
Benin
Bolivia
Bosnia and Herzegovina
Botswana
Brazil
Bulgaria
Burkina Faso
Cameroon
China
Colombia
Congo, Dem. Rep.
Congo, Rep.
Costa Rica
Cote d'Ivoire
Dominica
Dominican Republic
East Asia & Pacific (excluding high income)
Ecuador
Egypt, Arab Rep.
El Salvador
Ethiopia
Europe & Central Asia (excluding high income)
Fiji
Gabon
Georgia
Ghana
Grenada
Guatemala
Guinea
Guyana
Honduras
IDA only
India
Indonesia
Jamaica
Jordan
Kazakhstan
Kenya
Lao PDR
Latin America & Caribbean (excluding high income)
Lebanon
Low & middle income
Low income
Lower middle income
Macedonia, FYR
Malawi
Malaysia
Mauritania
Mauritius
Mexico
Middle East & North Africa (excluding high income)
Middle income
Moldova
Mongolia
Montenegro
Morocco
Mozambique
Nicaragua
Niger
Nigeria
Pakistan
Panama
Papua New Guinea
Paraguay
Peru
Philippines
Romania
Russian Federation
Rwanda
Samoa
Senegal
Serbia
Sierra Leone
South Africa
South Asia
Sri Lanka
St. Lucia
St. Vincent and the Grenadines
Sub-Saharan Africa (excluding high income)
Sudan
Thailand
Togo
Tunisia
Turkey
Uganda
Ukraine
Upper middle income
Venezuela, RB
Vietnam
Zambia
Zimbabwe
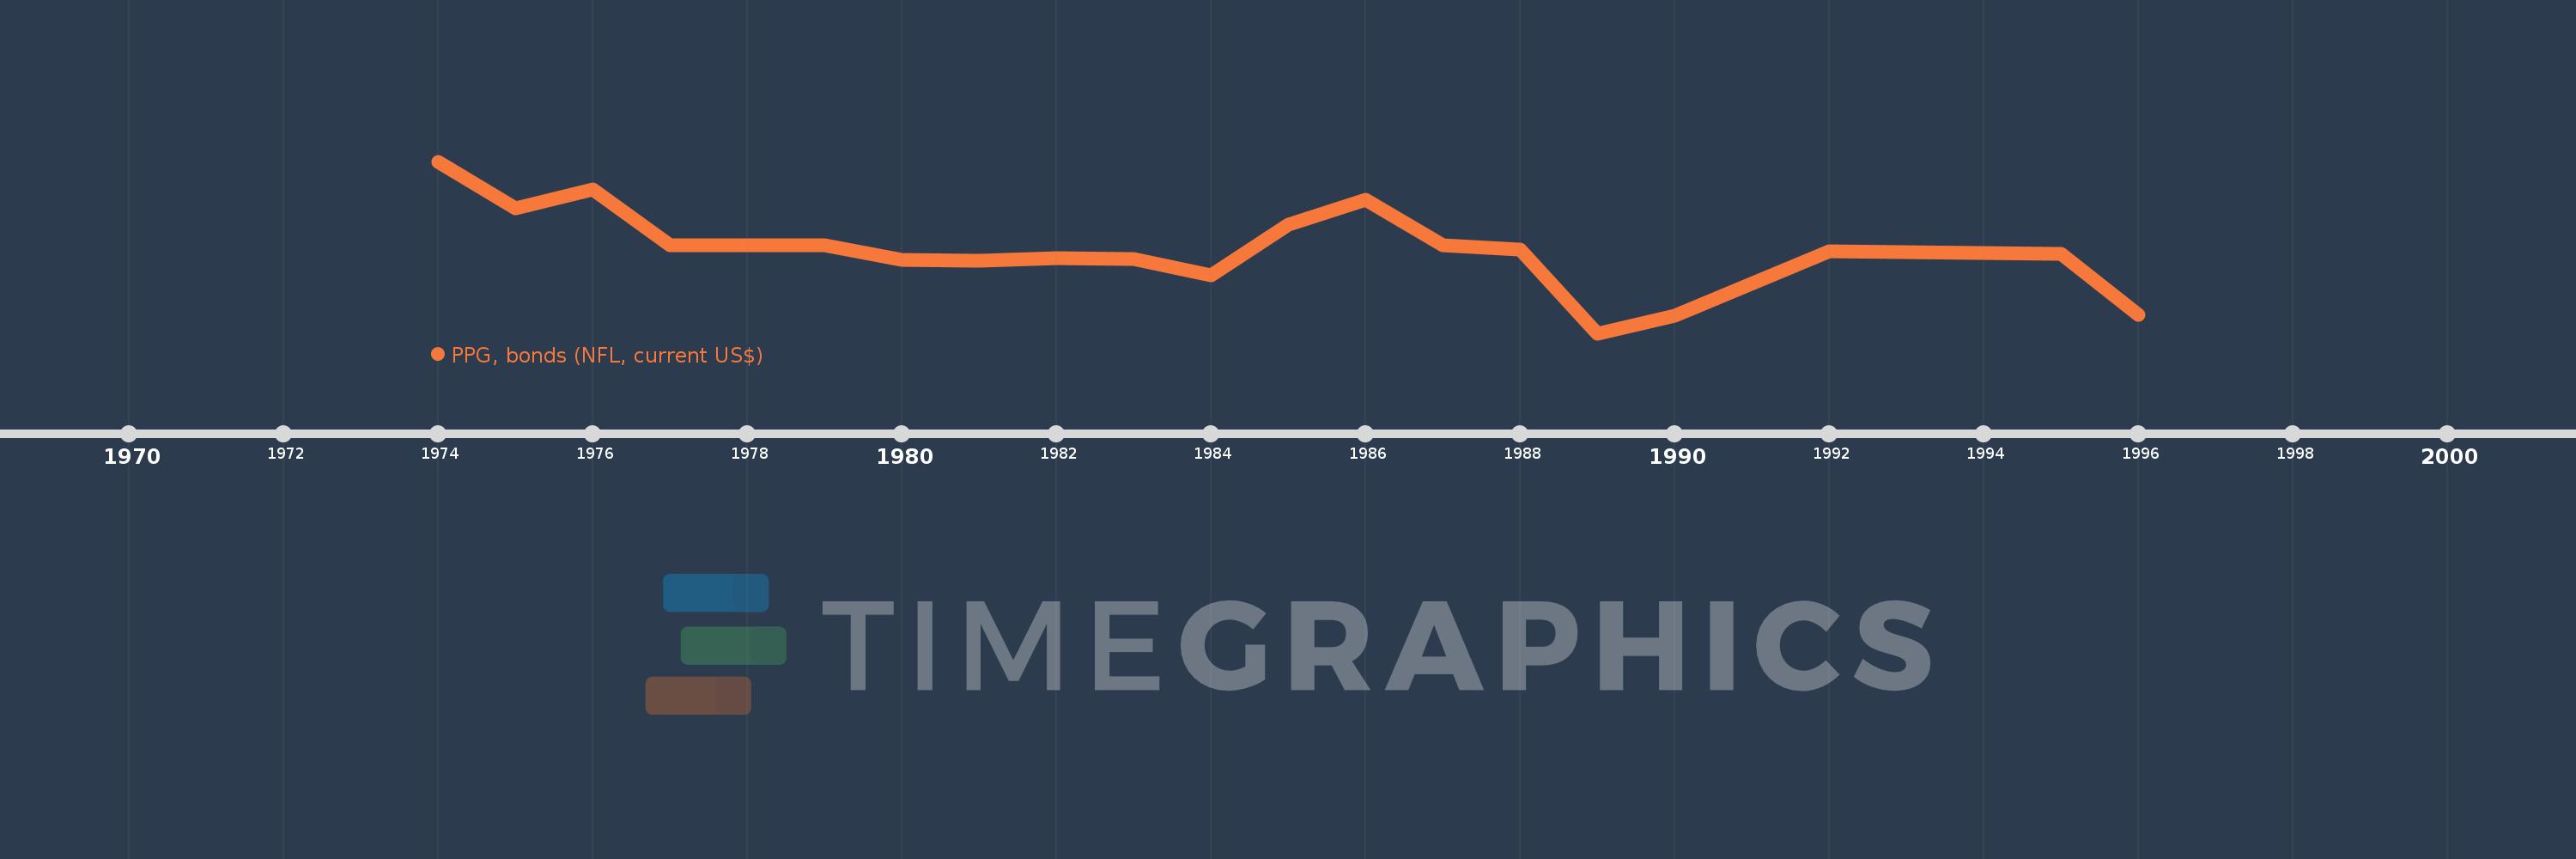
Timeline:
This timeline shows a graph from
1974
to
1996
of Papua New Guinea. No data until
1973
. Number of actual observations by date:
22
.
Source name:
World Development Indicators
Source organization:
World Bank, International Debt Statistics.
Categories, topics:
External Debt
Last updated:
apr 23, 2017
Indicators value changes by year
Meaning:
-3.173 mln
Minimum:
-40.501 mln
jan 1, 1989
Maximum:
36.473 mln
jan 1, 1974
At the date of observation
Value
Absolute change
Change from the previous value
jan 1, 1974
36.473 mln
+36.473 mln
0.0%
jan 1, 1975
15.651 mln
-20.822 mln
-57.09%
jan 1, 1976
23.933 mln
+8.282 mln
52.92%
jan 1, 1977
-1000.0K
-24.933 mln
-104.18%
jan 1, 1978
-1000.0K
0.0
0.0%
jan 1, 1979
-1000.0K
0.0
0.0%
jan 1, 1980
-7.52 mln
-6.52 mln
652.0%
jan 1, 1981
-8.097 mln
-577.0K
7.67%
jan 1, 1982
-6.827 mln
+1.27 mln
-15.68%
jan 1, 1983
-7.16 mln
-333.0K
4.88%
jan 1, 1984
-14.513 mln
-7.353 mln
102.7%
jan 1, 1985
8.299 mln
+22.812 mln
-157.18%
jan 1, 1986
19.204 mln
+10.905 mln
131.4%
jan 1, 1987
-945.0K
-20.149 mln
-104.92%
jan 1, 1988
-3.028 mln
-2.083 mln
220.42%
jan 1, 1989
-40.501 mln
-37.473 mln
1.24K%
jan 1, 1990
-32.599 mln
+7.902 mln
-19.51%
jan 1, 1992
-3.719 mln
+28.88 mln
-88.59%
jan 1, 1993
-3.951 mln
-232.0K
6.24%
jan 1, 1994
-4.511 mln
-560.0K
14.17%
jan 1, 1995
-4.899 mln
-388.0K
8.6%
jan 1, 1996
-32.089 mln
-27.19 mln
555.01%
Ranking of countries by current statistics by years
About & Feedback
Terms
Privacy
FAQ
Support 24/7
Cabinet
Get premium
Donate
The service accepts bank transfer (ACH, Wire) or cards (Visa, MasterCard, etc). Processed by Stripe.
Secured with SSL