Download This statistics in other country:
Timeline:
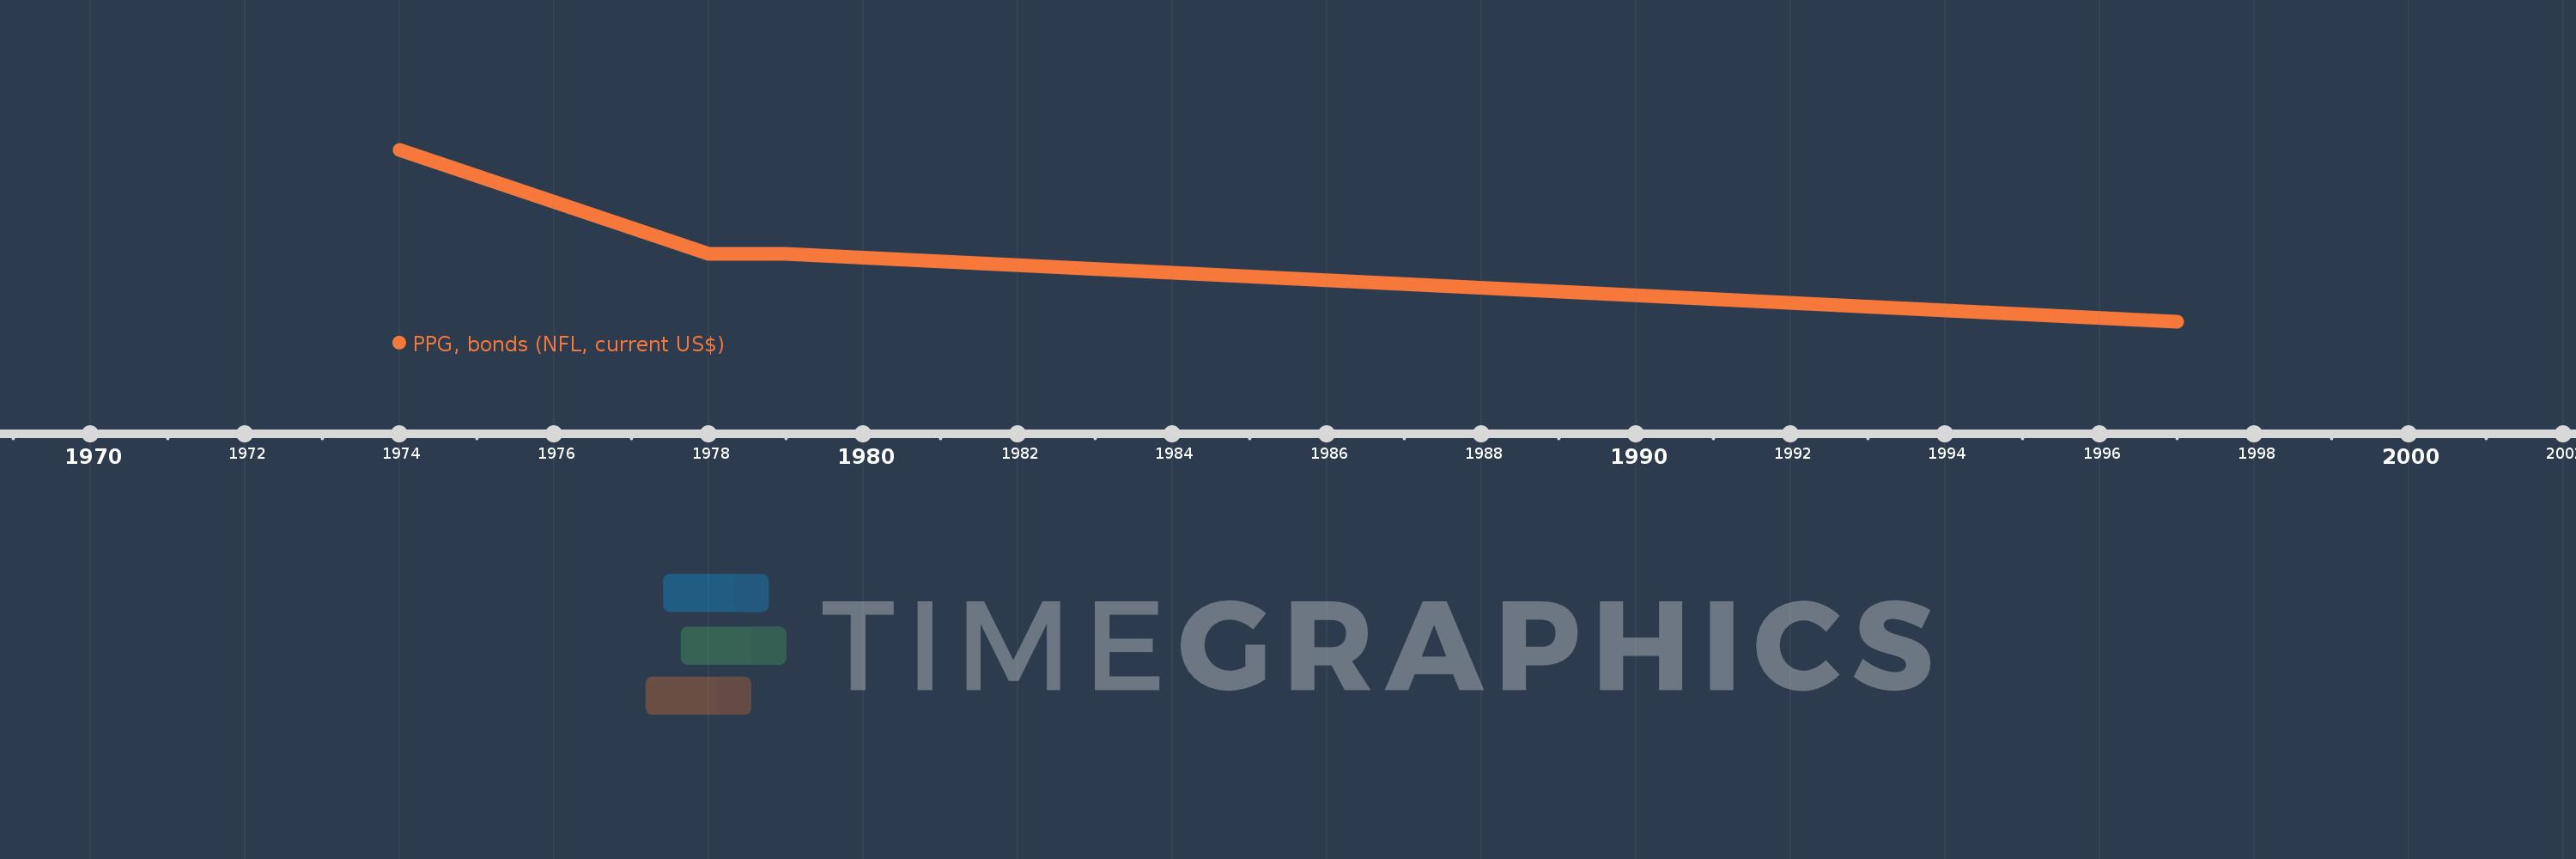
This timeline shows a graph from 1974 to 1997 of Nicaragua. No data until 1973. Number of actual observations by date: 4.
Source name:
World Development Indicators
Source organization:
World Bank, International Debt Statistics.
Categories, topics:
External Debt
Last updated:
apr 23, 2017
Indicators value changes by year
Minimum:
-8.008 mln
jan 1, 1997
Maximum:
10.0 mln
jan 1, 1974
At the date of observation
Value
Absolute change
Change from the previous value
jan 1, 1974
10.0 mln
+10.0 mln
0.0%
jan 1, 1978
-850.0K
-10.85 mln
-108.5%
jan 1, 1979
-850.0K
0.0
0.0%
jan 1, 1997
-8.008 mln
-7.158 mln
842.12%
Ranking of countries by current statistics by years