33
/
AIzaSyB4mHJ5NPEv-XzF7P6NDYXjlkCWaeKw5bc
November 30, 2025
218841
Panama
PAN
true
2
1
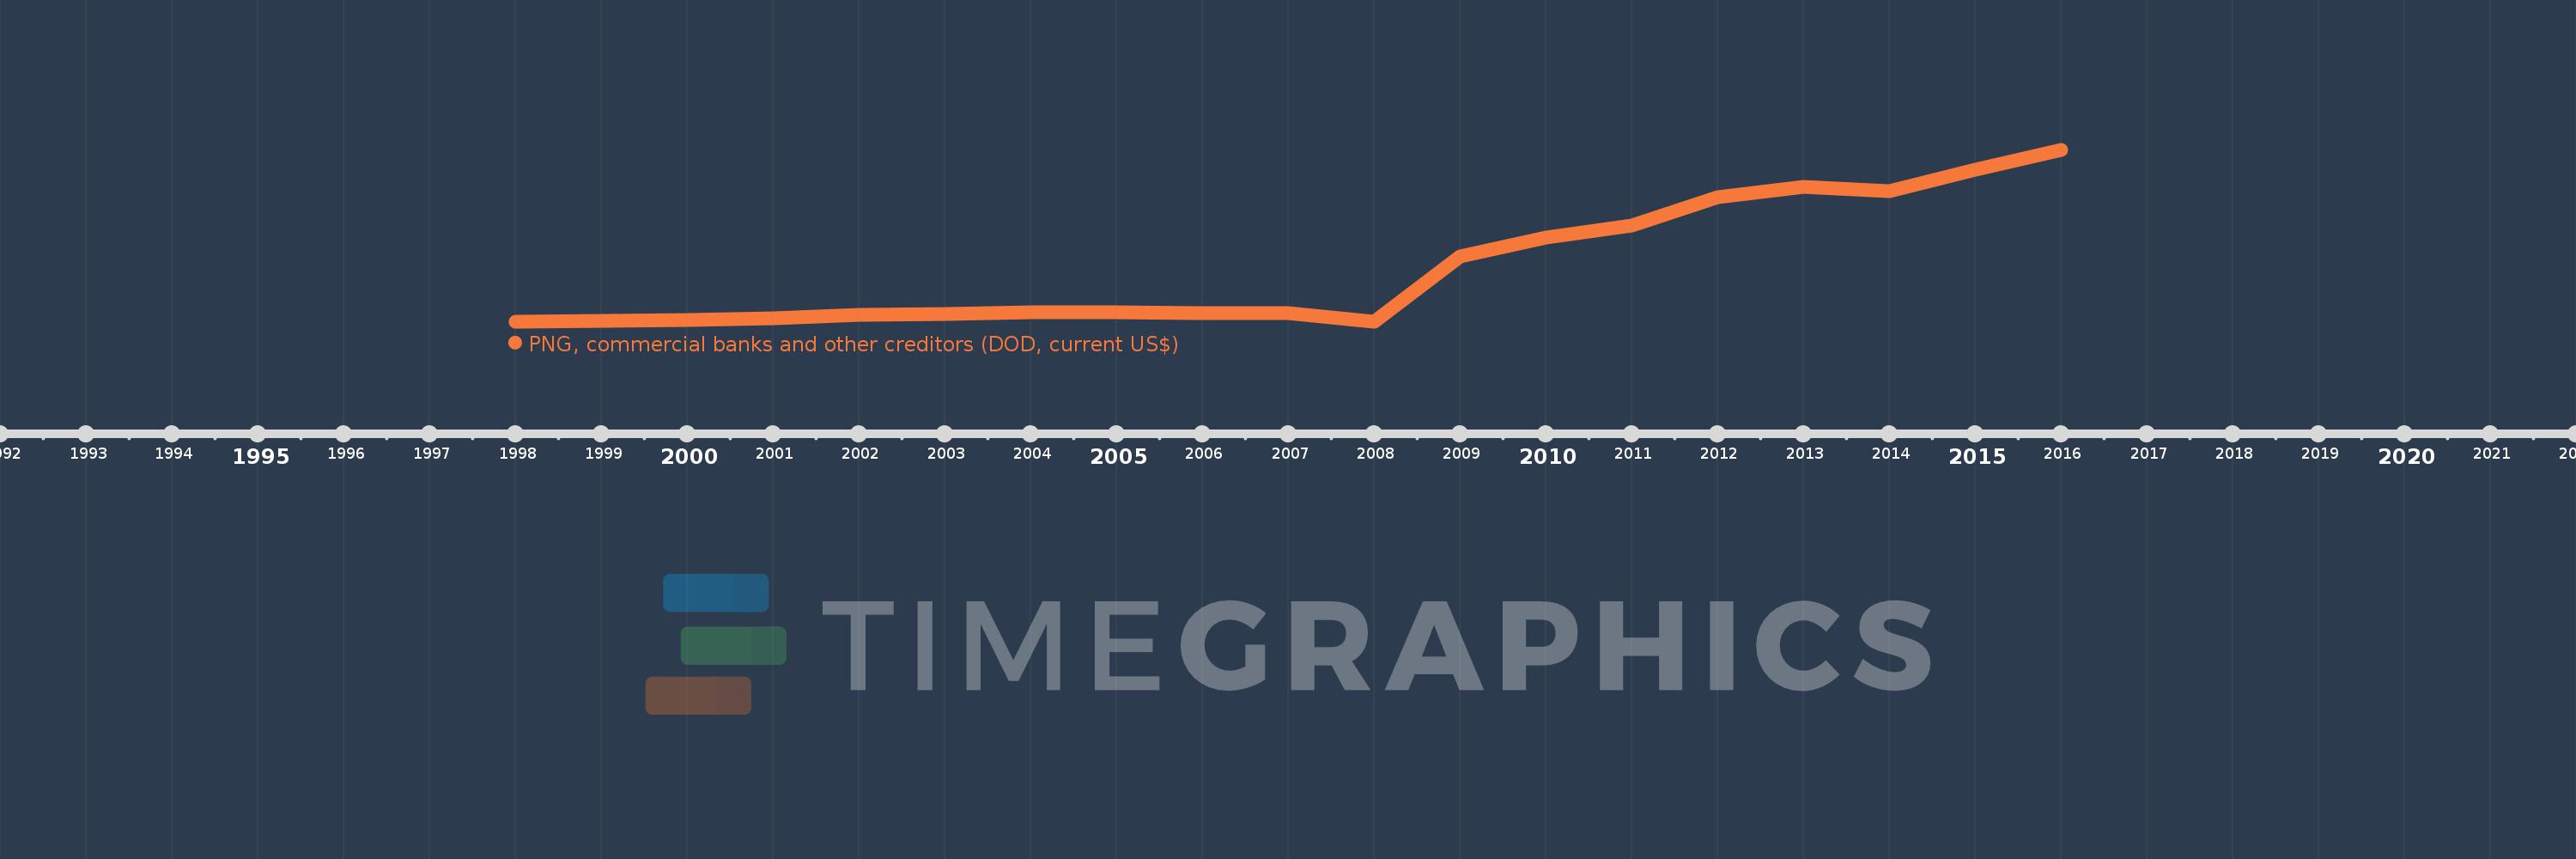
PNG, commercial banks and other creditors (DOD, current US$)
2016,2015,2014,2013,2012,2011,2010,2009,2008,2007,2006,2005,2004,2003,2002,2001,2000,1999,1998
Create a timeline
Public Timelines
For education
For educational institutions
For teachers
For students
Cabinet
For educational institutions
For teachers
For students
Open cabinet
FAQ
Close
Create a timeline
Public timelines
FAQ
About & Feedback
Terms
Privacy
FAQ
Support 24/7
Cabinet
Get premium
Donate
Download
Global statistics library
→
Panama
→
PNG, commercial banks and other creditors (DOD, current US$)
This statistics in other country:
Albania
Algeria
Argentina
Armenia
Azerbaijan
Bangladesh
Belarus
Belize
Bhutan
Bolivia
Bosnia and Herzegovina
Brazil
Bulgaria
Cambodia
Cameroon
China
Colombia
Costa Rica
Cote d'Ivoire
Dominican Republic
East Asia & Pacific (excluding high income)
Ecuador
Egypt, Arab Rep.
El Salvador
Europe & Central Asia (excluding high income)
Fiji
Georgia
Ghana
Guatemala
Guyana
Haiti
Honduras
IDA only
India
Indonesia
Iran, Islamic Rep.
Jamaica
Jordan
Kazakhstan
Kenya
Kosovo
Kyrgyz Republic
Lao PDR
Latin America & Caribbean (excluding high income)
Liberia
Low & middle income
Low income
Lower middle income
Macedonia, FYR
Madagascar
Malawi
Malaysia
Maldives
Mauritius
Mexico
Middle East & North Africa (excluding high income)
Middle income
Moldova
Mongolia
Montenegro
Morocco
Myanmar
Nicaragua
Niger
Nigeria
Pakistan
Panama
Papua New Guinea
Paraguay
Peru
Philippines
Romania
Russian Federation
Senegal
Serbia
Solomon Islands
South Africa
South Asia
Sri Lanka
Sub-Saharan Africa (excluding high income)
Sudan
Tajikistan
Tanzania
Thailand
Tunisia
Turkey
Turkmenistan
Ukraine
Upper middle income
Uzbekistan
Venezuela, RB
Vietnam
Zambia
Zimbabwe
Timeline:
This timeline shows a graph from
1998
to
2016
of Panama. No data until
1997
. Number of actual observations by date:
19
.
Source name:
World Development Indicators
Source organization:
World Bank, International Debt Statistics.
Categories, topics:
External Debt
Last updated:
apr 23, 2017
Indicators value changes by year
Meaning:
6.896 bln
Minimum:
0.0
jan 1, 2008
Maximum:
22.08 bln
jan 1, 2016
At the date of observation
Value
Absolute change
Change from the previous value
jan 1, 1998
23.333 mln
+23.333 mln
0.0%
jan 1, 1999
103.317 mln
+79.984 mln
342.79%
jan 1, 2000
301.216 mln
+197.899 mln
191.55%
jan 1, 2001
514.115 mln
+212.899 mln
70.68%
jan 1, 2002
875.412 mln
+361.297 mln
70.28%
jan 1, 2003
1.042 bln
+166.941 mln
19.07%
jan 1, 2004
1.213 bln
+170.635 mln
16.37%
jan 1, 2005
1.238 bln
+25.414 mln
2.1%
jan 1, 2006
1.107 bln
-131.274 mln
-10.6%
jan 1, 2007
1.113 bln
+6.293 mln
0.57%
jan 1, 2008
0.0
-1.113 bln
-100.0%
jan 1, 2009
8.447 bln
+8.447 bln
%
jan 1, 2010
10.817 bln
+2.371 bln
28.07%
jan 1, 2011
12.361 bln
+1.544 bln
14.27%
jan 1, 2012
16.025 bln
+3.664 bln
29.64%
jan 1, 2013
17.391 bln
+1.366 bln
8.52%
jan 1, 2014
16.799 bln
-591.1 mln
-3.4%
jan 1, 2015
19.568 bln
+2.769 bln
16.48%
jan 1, 2016
22.08 bln
+2.512 bln
12.84%
Ranking of countries by current statistics by years
About & Feedback
Terms
Privacy
FAQ
Support 24/7
Cabinet
Get premium
Donate
The service accepts bank transfer (ACH, Wire) or cards (Visa, MasterCard, etc). Processed by Stripe.
Secured with SSL