33
/
AIzaSyB4mHJ5NPEv-XzF7P6NDYXjlkCWaeKw5bc
November 30, 2025
138529
Georgia
GEO
true
2
1
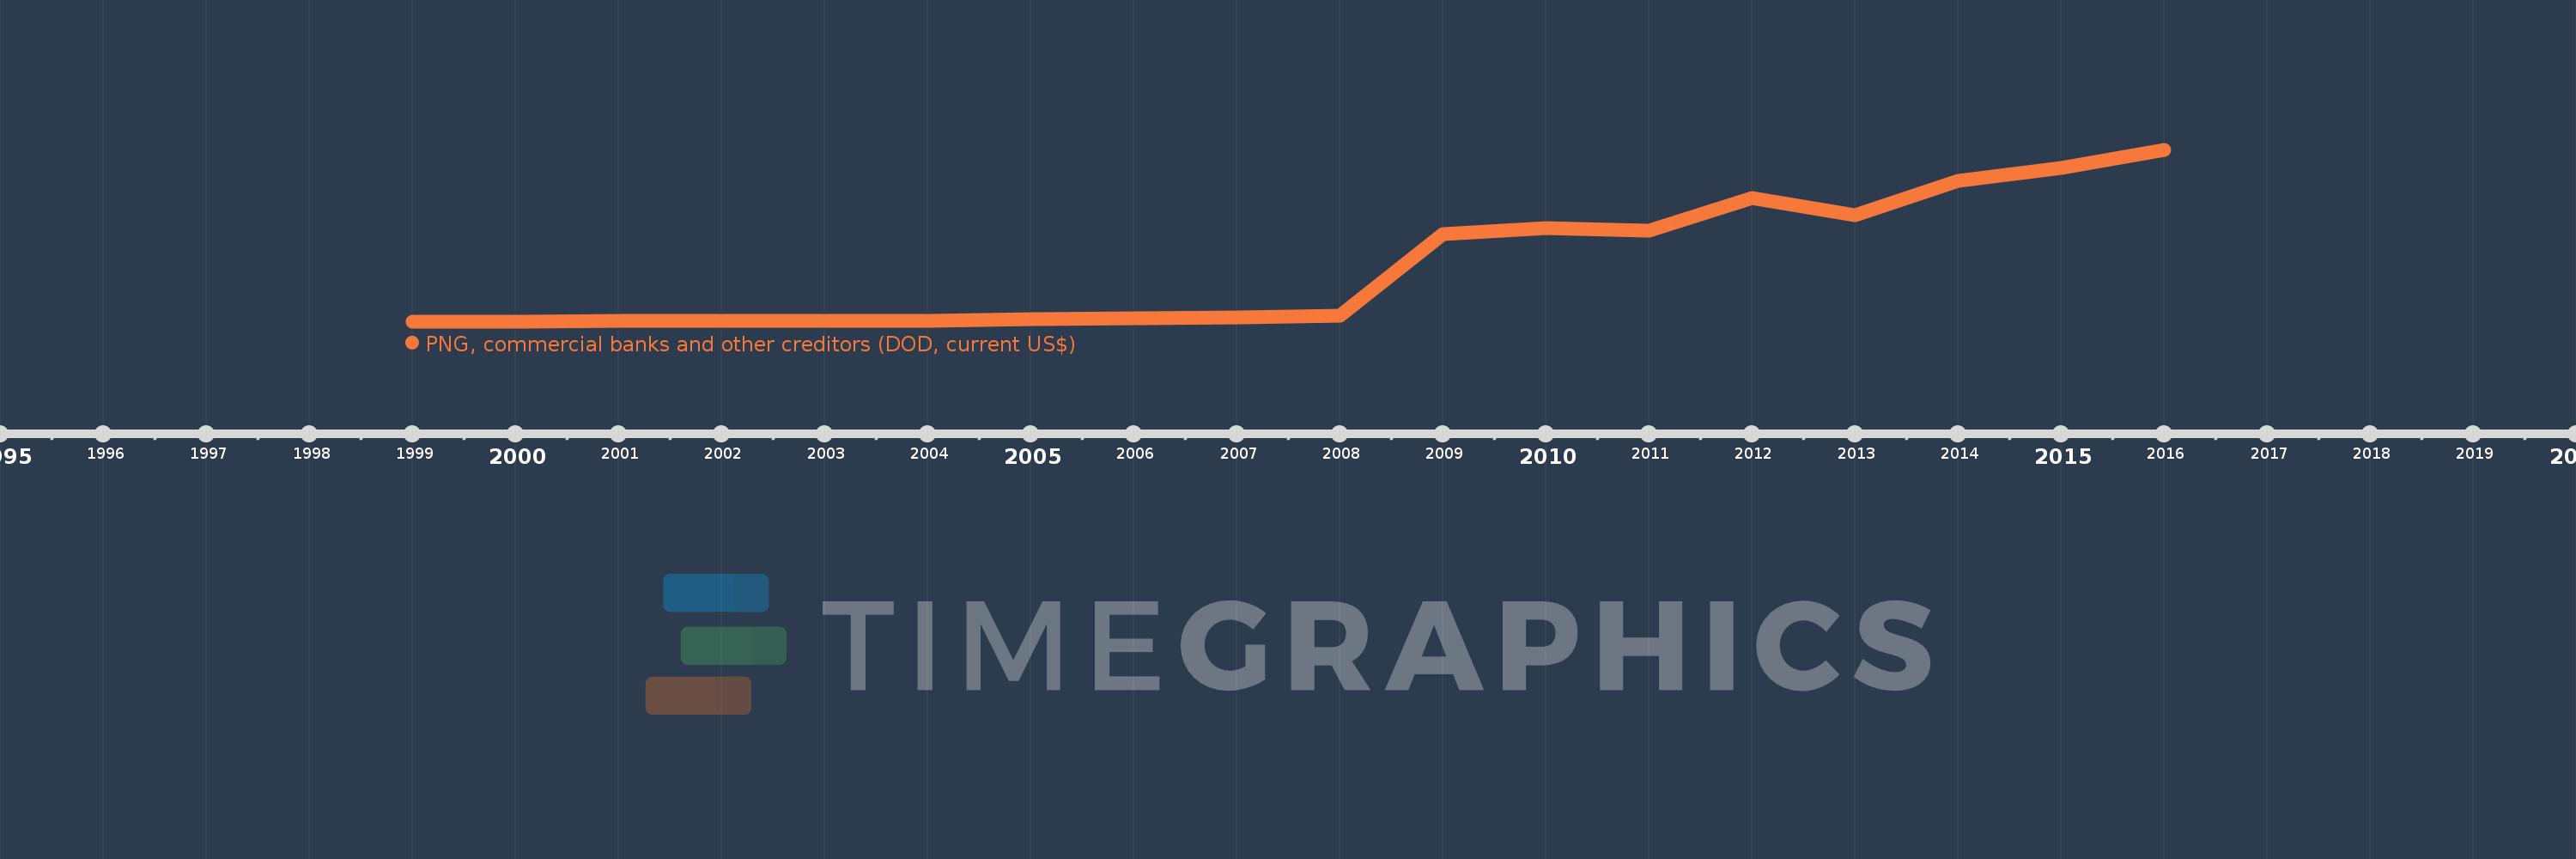
PNG, commercial banks and other creditors (DOD, current US$)
2016,2015,2014,2013,2012,2011,2010,2009,2008,2007,2006,2005,2004,2003,2002,2001,2000,1999
Create a timeline
Public Timelines
For education
For educational institutions
For teachers
For students
Cabinet
For educational institutions
For teachers
For students
Open cabinet
FAQ
Close
Create a timeline
Public timelines
FAQ
About & Feedback
Terms
Privacy
FAQ
Support 24/7
Cabinet
Get premium
Donate
Download
Global statistics library
→
Georgia
→
PNG, commercial banks and other creditors (DOD, current US$)
This statistics in other country:
Albania
Algeria
Argentina
Armenia
Azerbaijan
Bangladesh
Belarus
Belize
Bhutan
Bolivia
Bosnia and Herzegovina
Brazil
Bulgaria
Cambodia
Cameroon
China
Colombia
Costa Rica
Cote d'Ivoire
Dominican Republic
East Asia & Pacific (excluding high income)
Ecuador
Egypt, Arab Rep.
El Salvador
Europe & Central Asia (excluding high income)
Fiji
Georgia
Ghana
Guatemala
Guyana
Haiti
Honduras
IDA only
India
Indonesia
Iran, Islamic Rep.
Jamaica
Jordan
Kazakhstan
Kenya
Kosovo
Kyrgyz Republic
Lao PDR
Latin America & Caribbean (excluding high income)
Liberia
Low & middle income
Low income
Lower middle income
Macedonia, FYR
Madagascar
Malawi
Malaysia
Maldives
Mauritius
Mexico
Middle East & North Africa (excluding high income)
Middle income
Moldova
Mongolia
Montenegro
Morocco
Myanmar
Nicaragua
Niger
Nigeria
Pakistan
Panama
Papua New Guinea
Paraguay
Peru
Philippines
Romania
Russian Federation
Senegal
Serbia
Solomon Islands
South Africa
South Asia
Sri Lanka
Sub-Saharan Africa (excluding high income)
Sudan
Tajikistan
Tanzania
Thailand
Tunisia
Turkey
Turkmenistan
Ukraine
Upper middle income
Uzbekistan
Venezuela, RB
Vietnam
Zambia
Zimbabwe
Timeline:
This timeline shows a graph from
1999
to
2016
of Georgia. No data until
1998
. Number of actual observations by date:
18
.
Source name:
World Development Indicators
Source organization:
World Bank, International Debt Statistics.
Categories, topics:
External Debt
Last updated:
apr 23, 2017
Indicators value changes by year
Meaning:
1.895 bln
Minimum:
15.168 mln
jan 1, 1999
Maximum:
5.881 bln
jan 1, 2016
At the date of observation
Value
Absolute change
Change from the previous value
jan 1, 1999
15.168 mln
+15.168 mln
0.0%
jan 1, 2000
17.078 mln
+1.91 mln
12.59%
jan 1, 2001
41.872 mln
+24.794 mln
145.18%
jan 1, 2002
52.878 mln
+11.006 mln
26.28%
jan 1, 2003
50.701 mln
-2.177 mln
-4.12%
jan 1, 2004
43.916 mln
-6.785 mln
-13.38%
jan 1, 2005
99.0 mln
+55.084 mln
125.43%
jan 1, 2006
131.619 mln
+32.619 mln
32.95%
jan 1, 2007
158.741 mln
+27.122 mln
20.61%
jan 1, 2008
240.647 mln
+81.906 mln
51.6%
jan 1, 2009
3.029 bln
+2.789 bln
1.16K%
jan 1, 2010
3.207 bln
+177.538 mln
5.86%
jan 1, 2011
3.143 bln
-63.747 mln
-1.99%
jan 1, 2012
4.262 bln
+1.119 bln
35.59%
jan 1, 2013
3.649 bln
-612.938 mln
-14.38%
jan 1, 2014
4.829 bln
+1.18 bln
32.35%
jan 1, 2015
5.26 bln
+431.267 mln
8.93%
jan 1, 2016
5.881 bln
+620.184 mln
11.79%
Ranking of countries by current statistics by years
About & Feedback
Terms
Privacy
FAQ
Support 24/7
Cabinet
Get premium
Donate
The service accepts bank transfer (ACH, Wire) or cards (Visa, MasterCard, etc). Processed by Stripe.
Secured with SSL