33
/
AIzaSyB4mHJ5NPEv-XzF7P6NDYXjlkCWaeKw5bc
November 30, 2025
218235
Panama
PAN
true
2
1
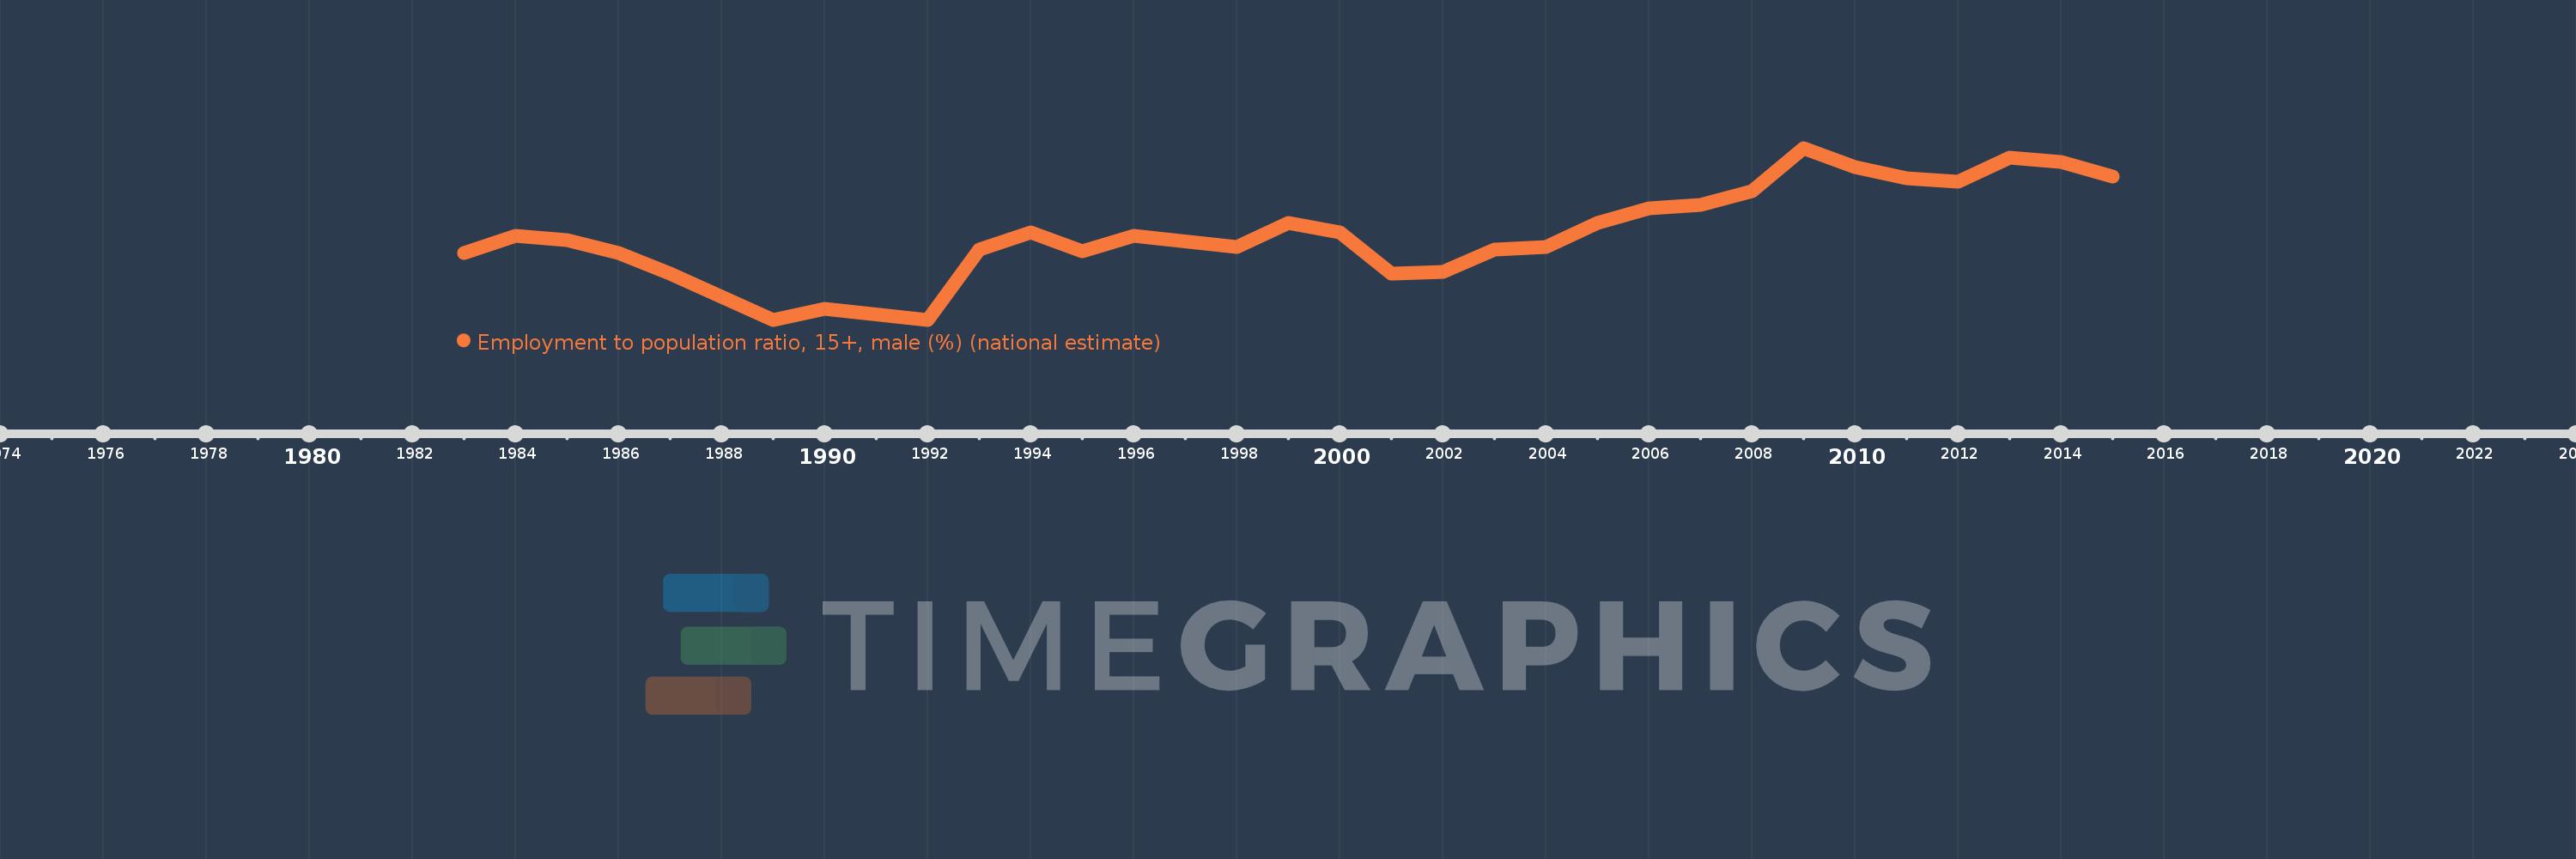
Employment to population ratio, 15+, male (%) (national estimate)
2015,2014,2013,2012,2011,2010,2009,2008,2007,2006,2005,2004,2003,2002,2001,2000,1999,1998,1996,1995,1994,1993,1992,1990,1989,1987,1986,1985,1984,1983