33
/
AIzaSyB4mHJ5NPEv-XzF7P6NDYXjlkCWaeKw5bc
November 30, 2025
155883
Indonesia
IDN
true
2
1
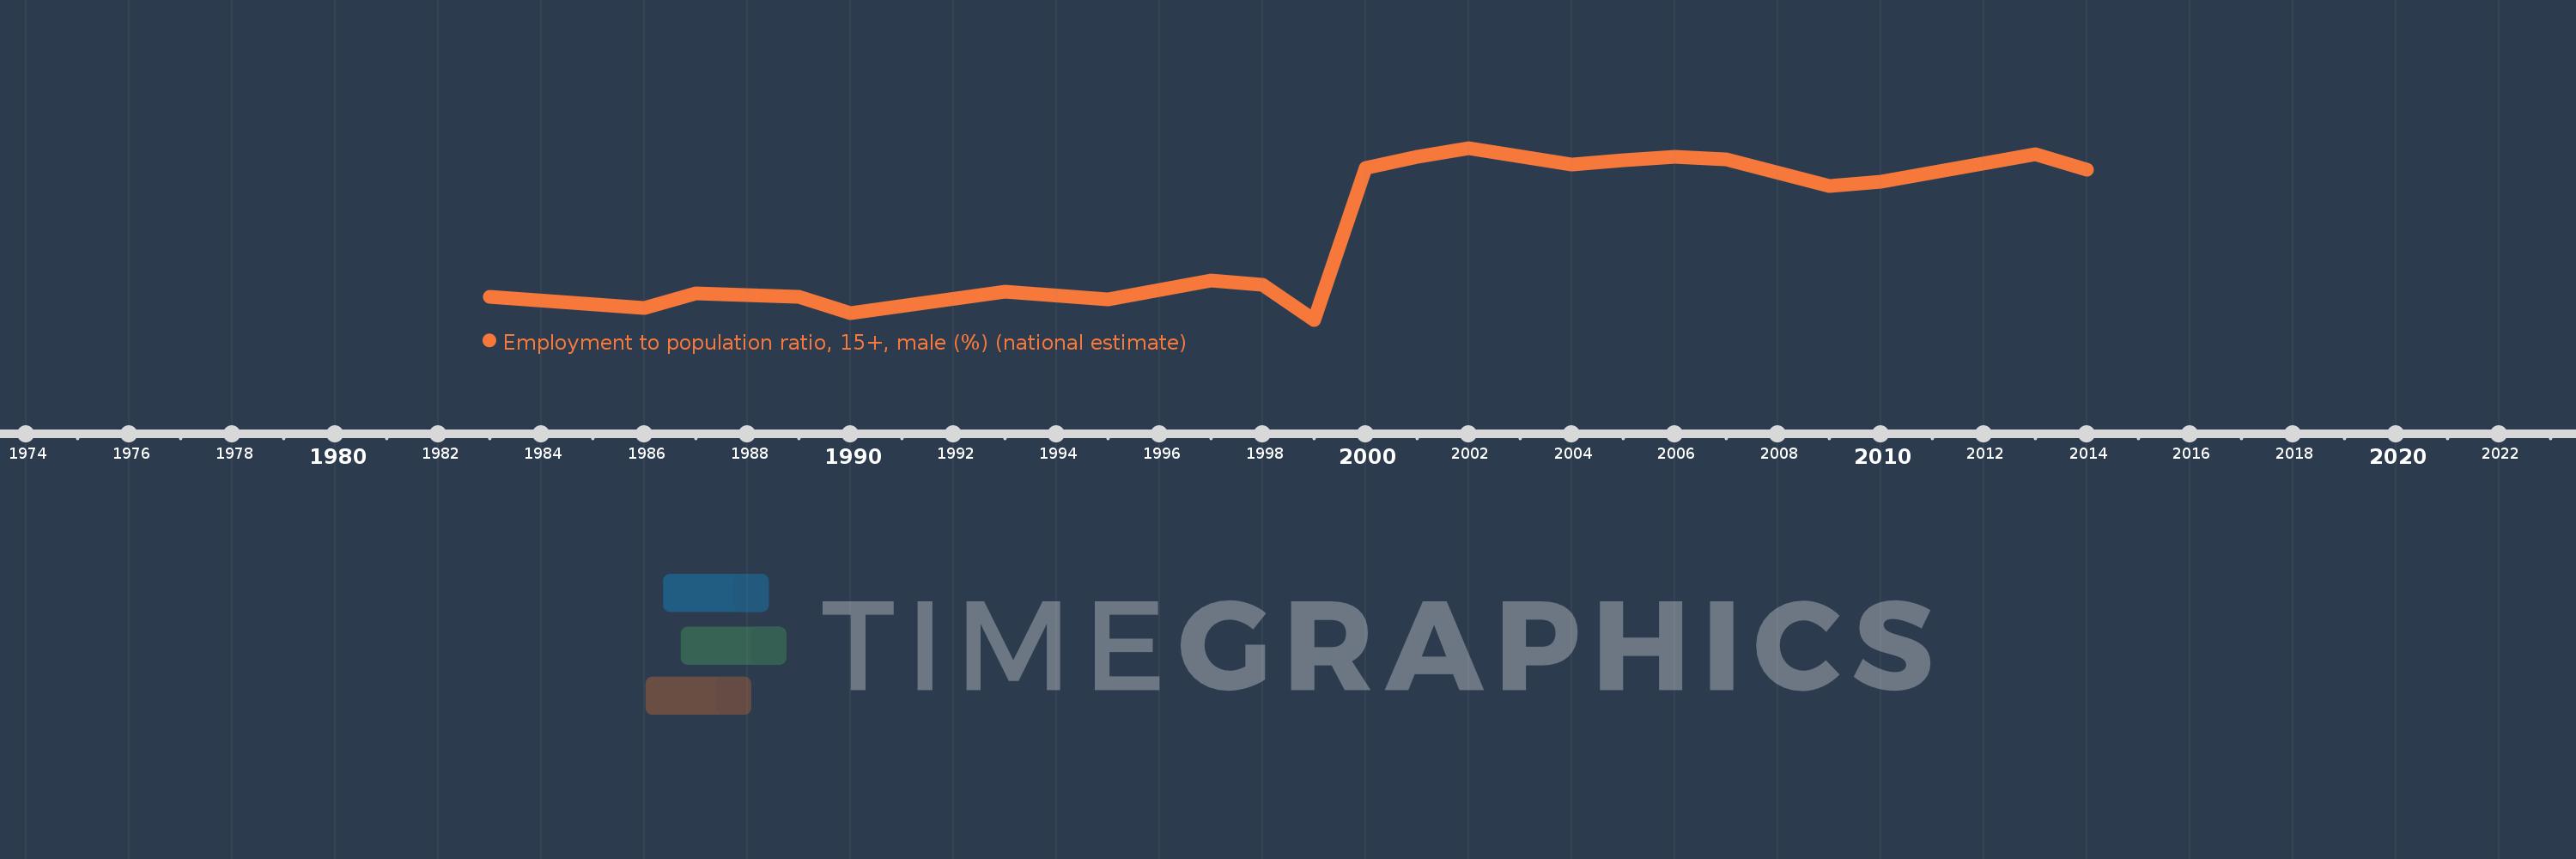
Employment to population ratio, 15+, male (%) (national estimate)
2014,2013,2010,2009,2007,2006,2005,2004,2002,2001,2000,1999,1998,1997,1995,1993,1990,1989,1987,1986,1983