Download This statistics in other country:
Timeline:
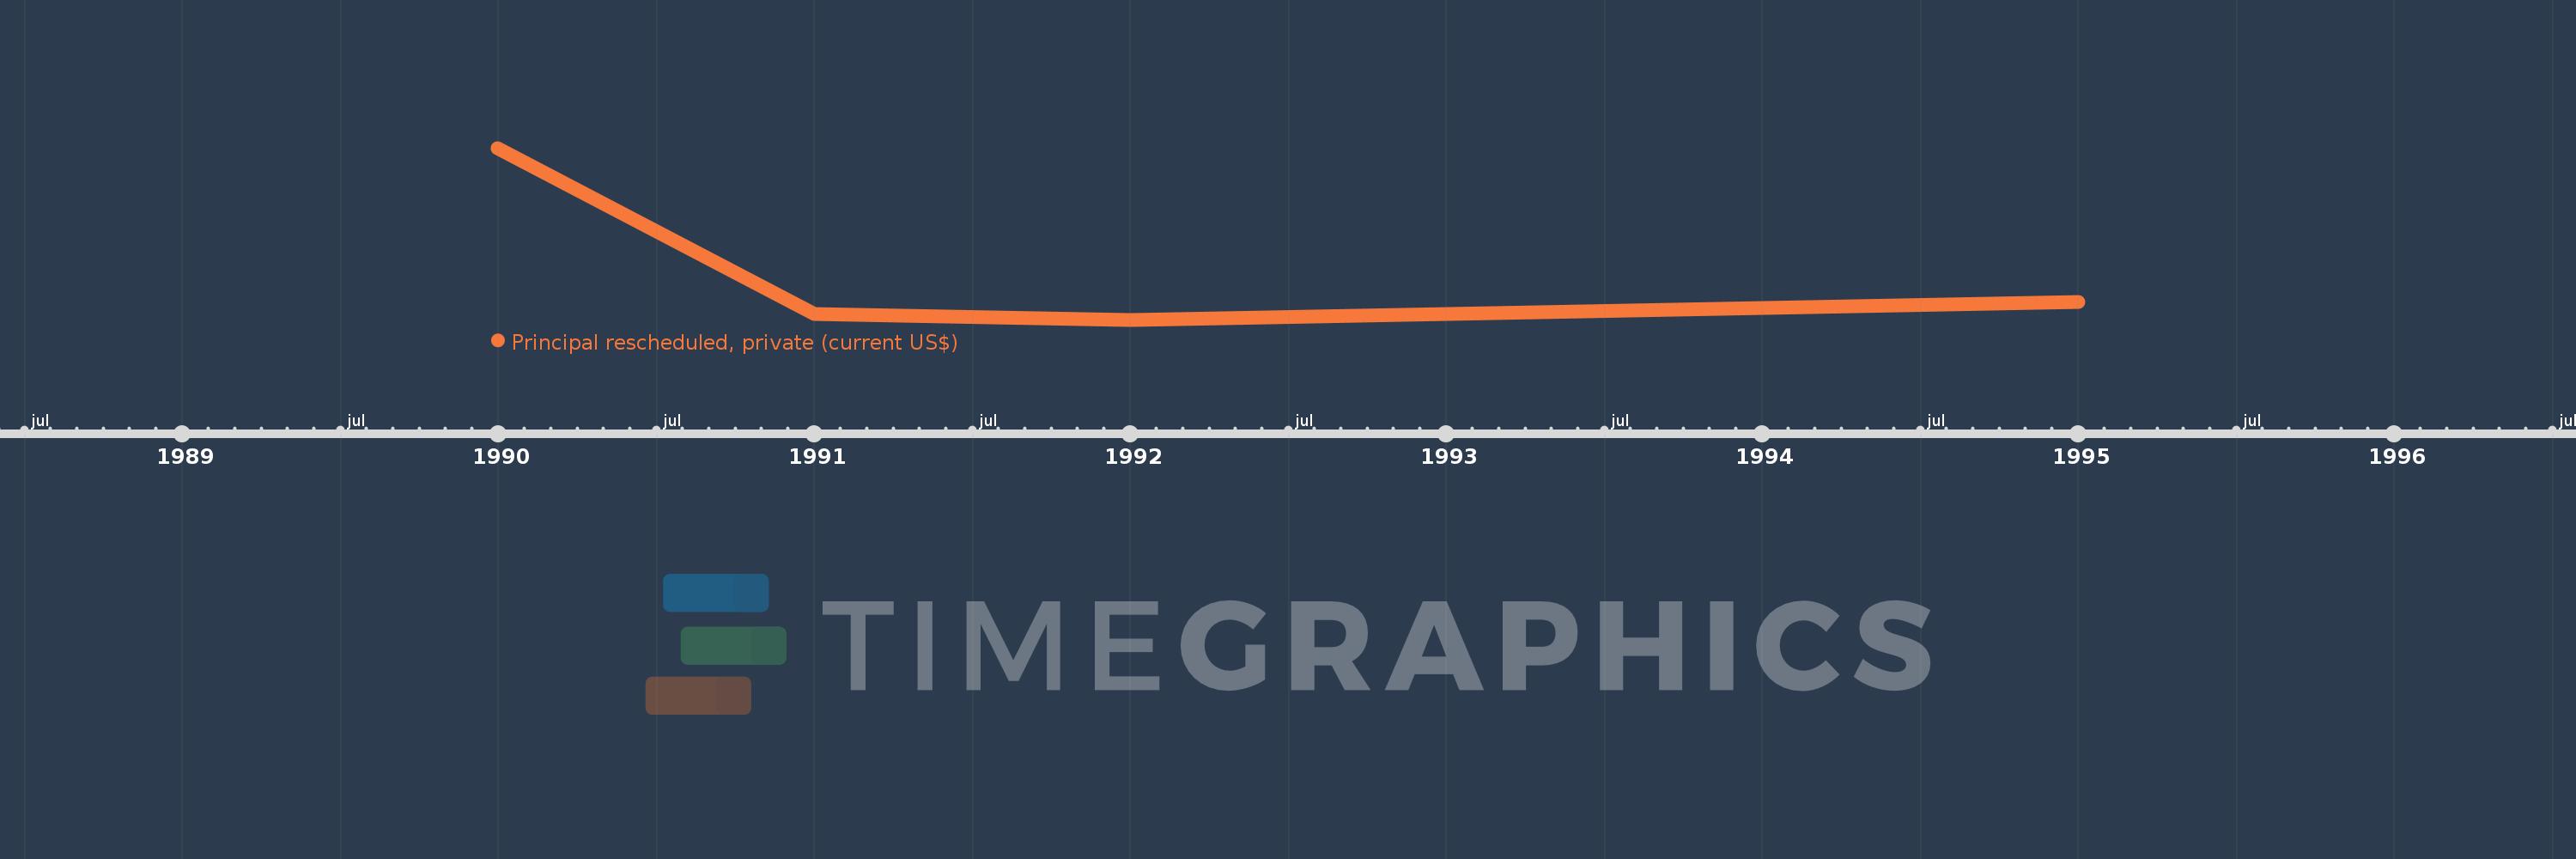
This timeline shows a graph from 1990 to 1995 of Niger. No data until 1989. Number of actual observations by date: 4.
Source name:
World Development Indicators
Source organization:
World Bank, International Debt Statistics.
Categories, topics:
External Debt
Last updated:
apr 23, 2017
Indicators value changes by year
Minimum:
203.0K
jan 1, 1992
Maximum:
6.549 mln
jan 1, 1990
At the date of observation
Value
Absolute change
Change from the previous value
jan 1, 1990
6.549 mln
+6.549 mln
0.0%
jan 1, 1991
406.0K
-6.143 mln
-93.8%
jan 1, 1992
203.0K
-203.0K
-50.0%
jan 1, 1995
875.0K
+672.0K
331.03%
Ranking of countries by current statistics by years