Download This statistics in other country:
Timeline:
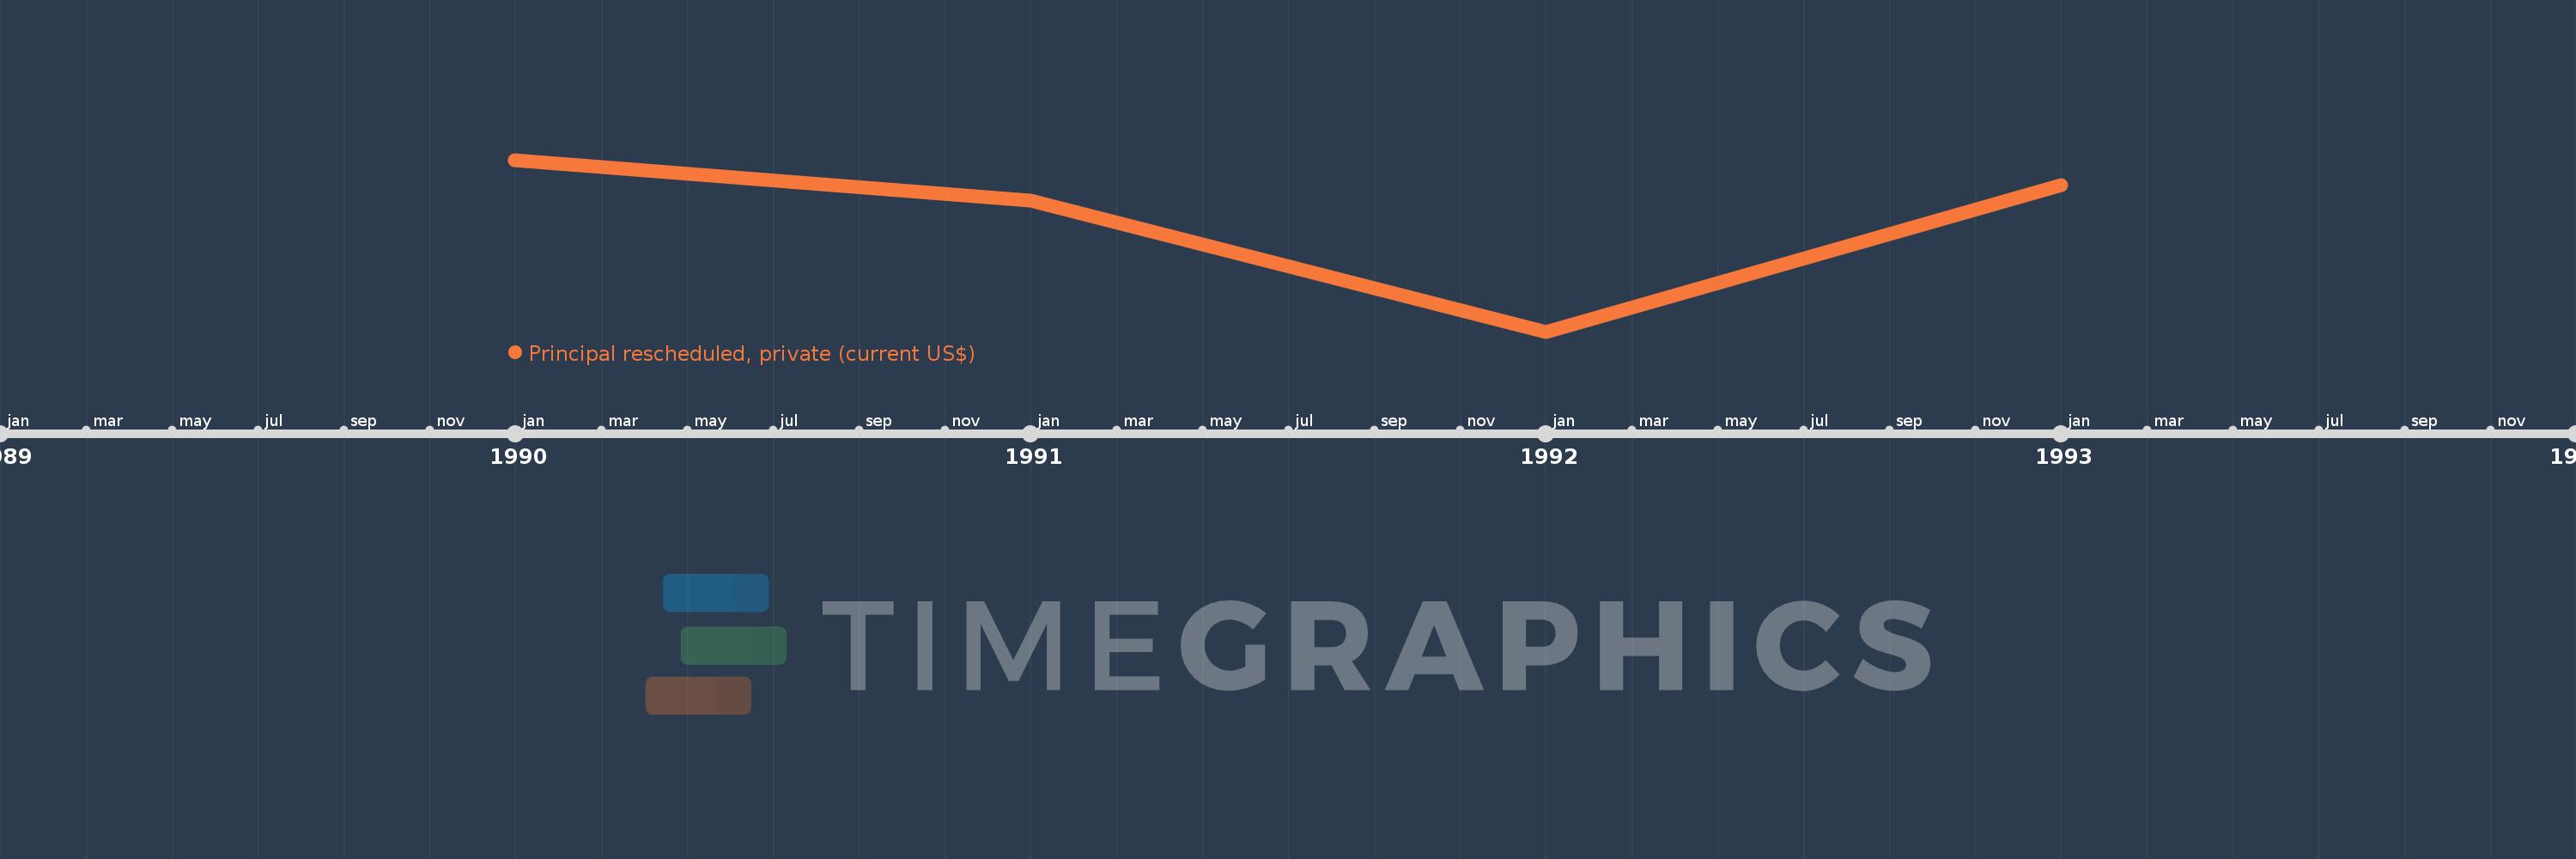
This timeline shows a graph from 1990 to 1993 of Morocco. No data until 1989. Number of actual observations by date: 4.
Source name:
World Development Indicators
Source organization:
World Bank, International Debt Statistics.
Categories, topics:
External Debt
Last updated:
apr 23, 2017
Indicators value changes by year
Minimum:
114.865 mln
jan 1, 1992
Maximum:
229.673 mln
jan 1, 1990
At the date of observation
Value
Absolute change
Change from the previous value
jan 1, 1990
229.673 mln
+229.673 mln
0.0%
jan 1, 1991
202.523 mln
-27.15 mln
-11.82%
jan 1, 1992
114.865 mln
-87.658 mln
-43.28%
jan 1, 1993
212.738 mln
+97.873 mln
85.21%
Ranking of countries by current statistics by years