33
/
AIzaSyB4mHJ5NPEv-XzF7P6NDYXjlkCWaeKw5bc
November 30, 2025
211877
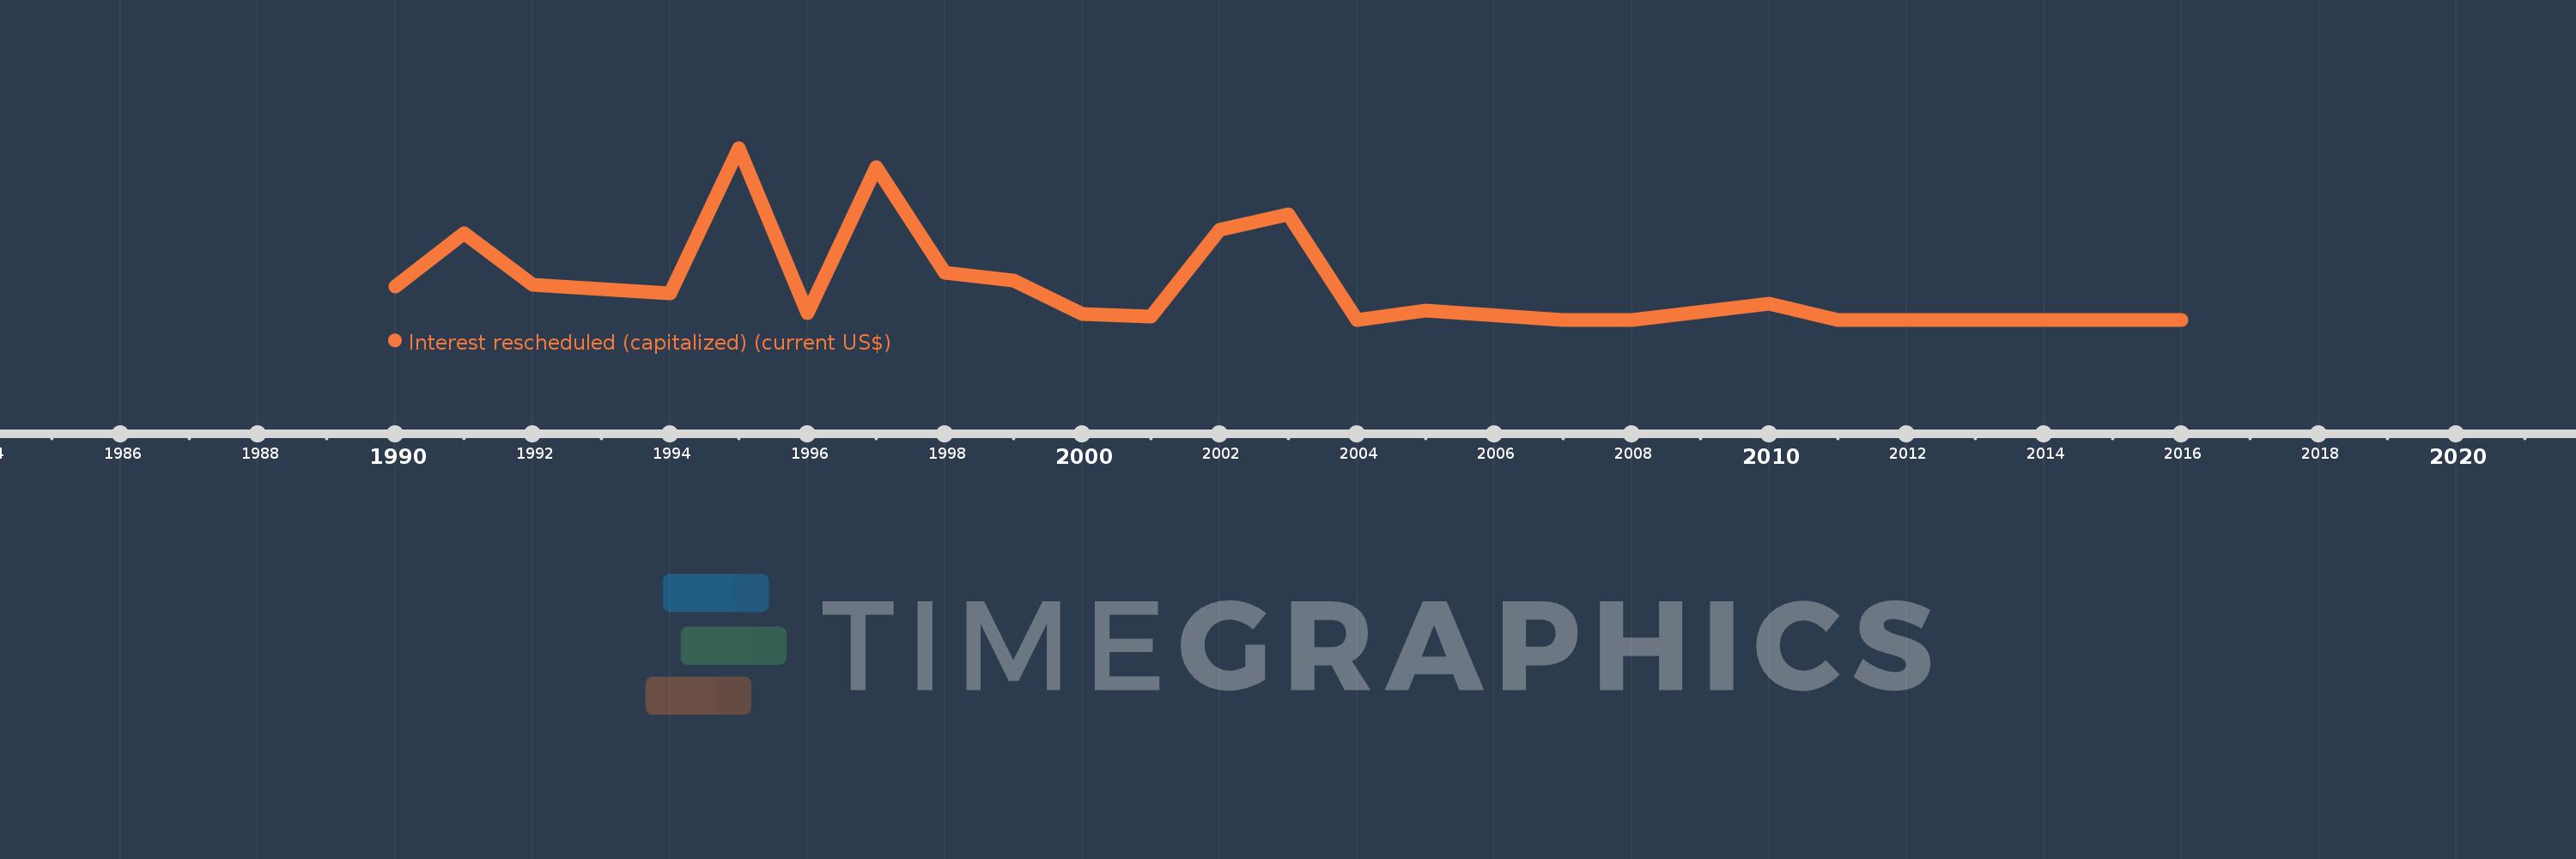
Niger
NER
true
2
1
Interest rescheduled (capitalized) (current US$)
2016,2015,2014,2013,2011,2010,2008,2007,2005,2004,2003,2002,2001,2000,1999,1998,1997,1996,1995,1994,1992,1991,1990