Download This statistics in other country:
Timeline:
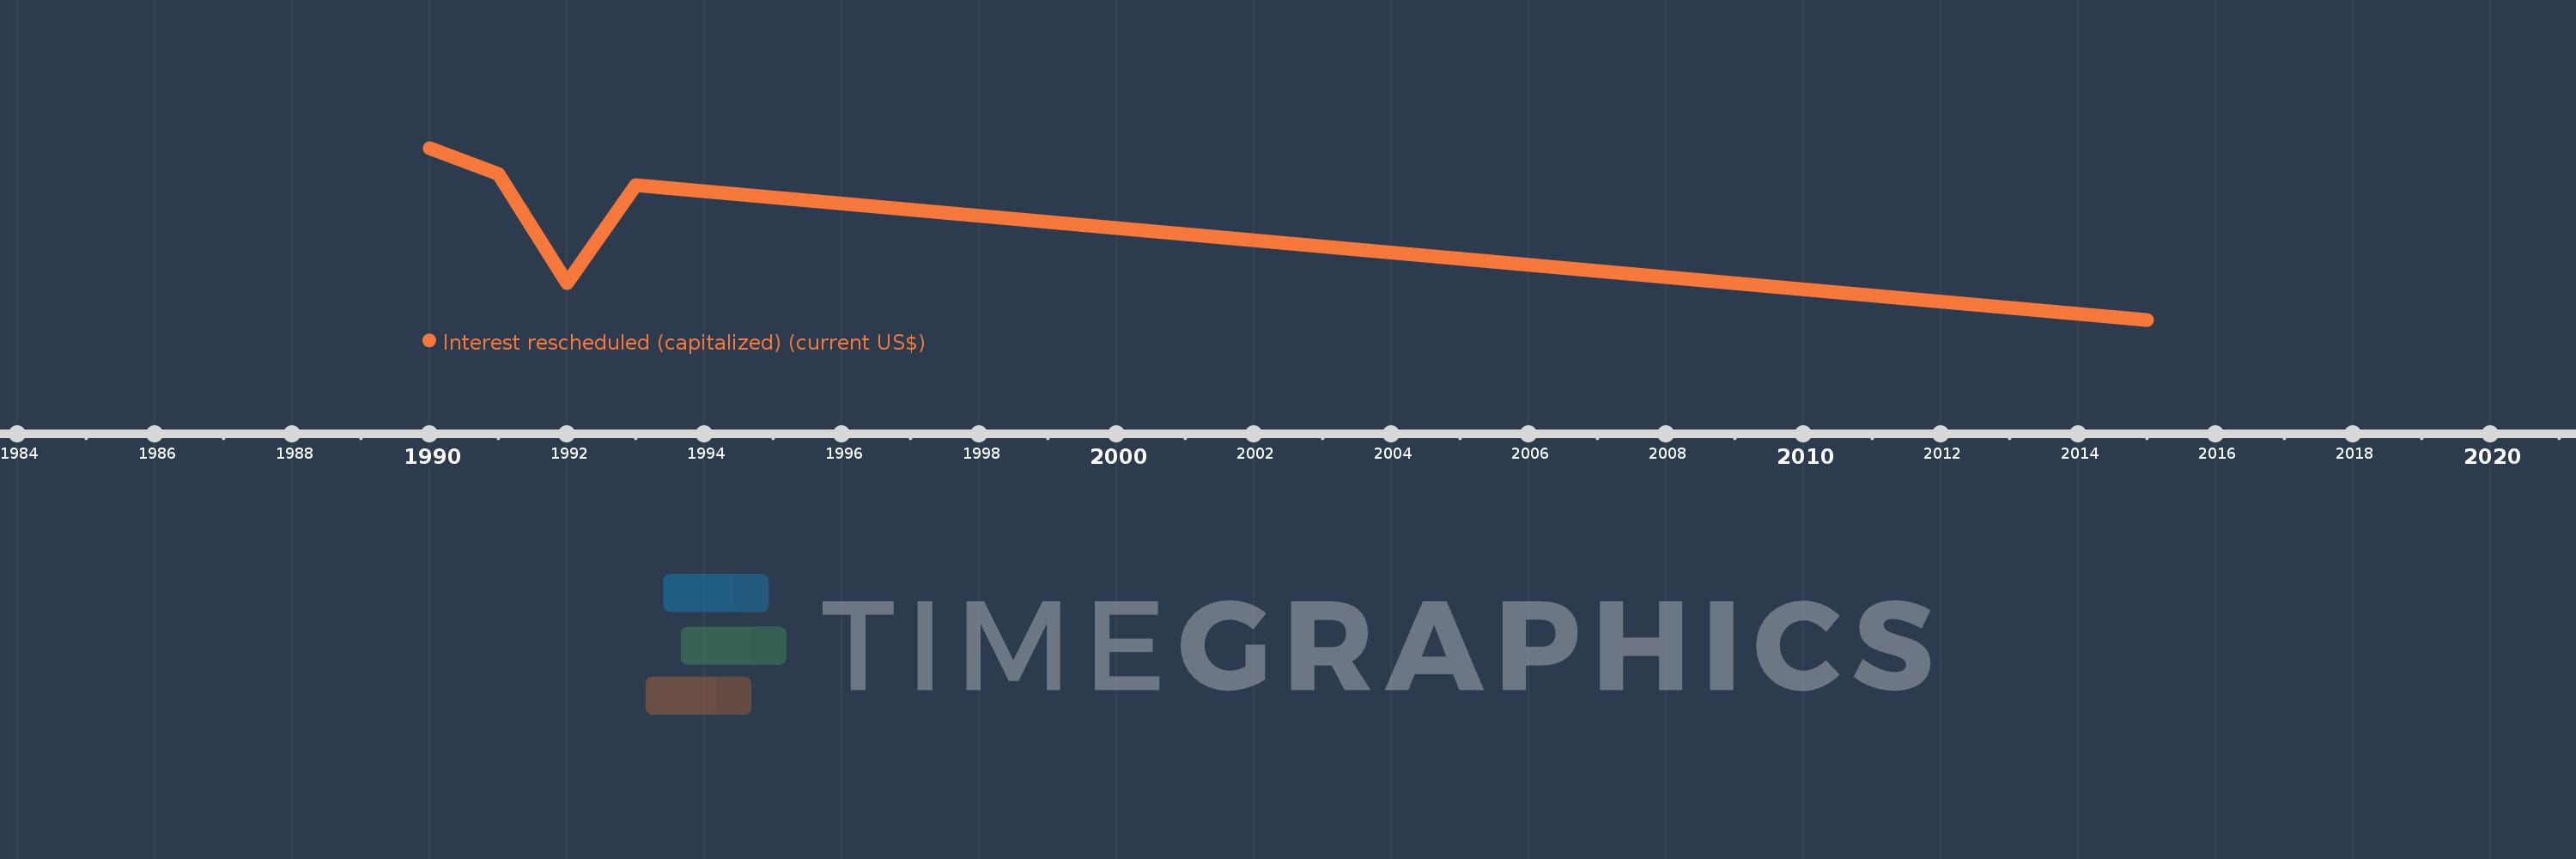
This timeline shows a graph from 1990 to 2015 of Morocco. No data until 1989. Number of actual observations by date: 5.
Source name:
World Development Indicators
Source organization:
World Bank, International Debt Statistics.
Categories, topics:
External Debt
Last updated:
apr 23, 2017
Indicators value changes by year
Maximum:
256.877 mln
jan 1, 1990
At the date of observation
Value
Absolute change
Change from the previous value
jan 1, 1990
256.877 mln
+256.877 mln
0.0%
jan 1, 1991
217.782 mln
-39.095 mln
-15.22%
jan 1, 1992
54.382 mln
-163.4 mln
-75.03%
jan 1, 1993
201.494 mln
+147.112 mln
270.52%
jan 1, 2015
0.0
-201.494 mln
-100.0%
Ranking of countries by current statistics by years