33
/
AIzaSyB4mHJ5NPEv-XzF7P6NDYXjlkCWaeKw5bc
November 30, 2025
211284
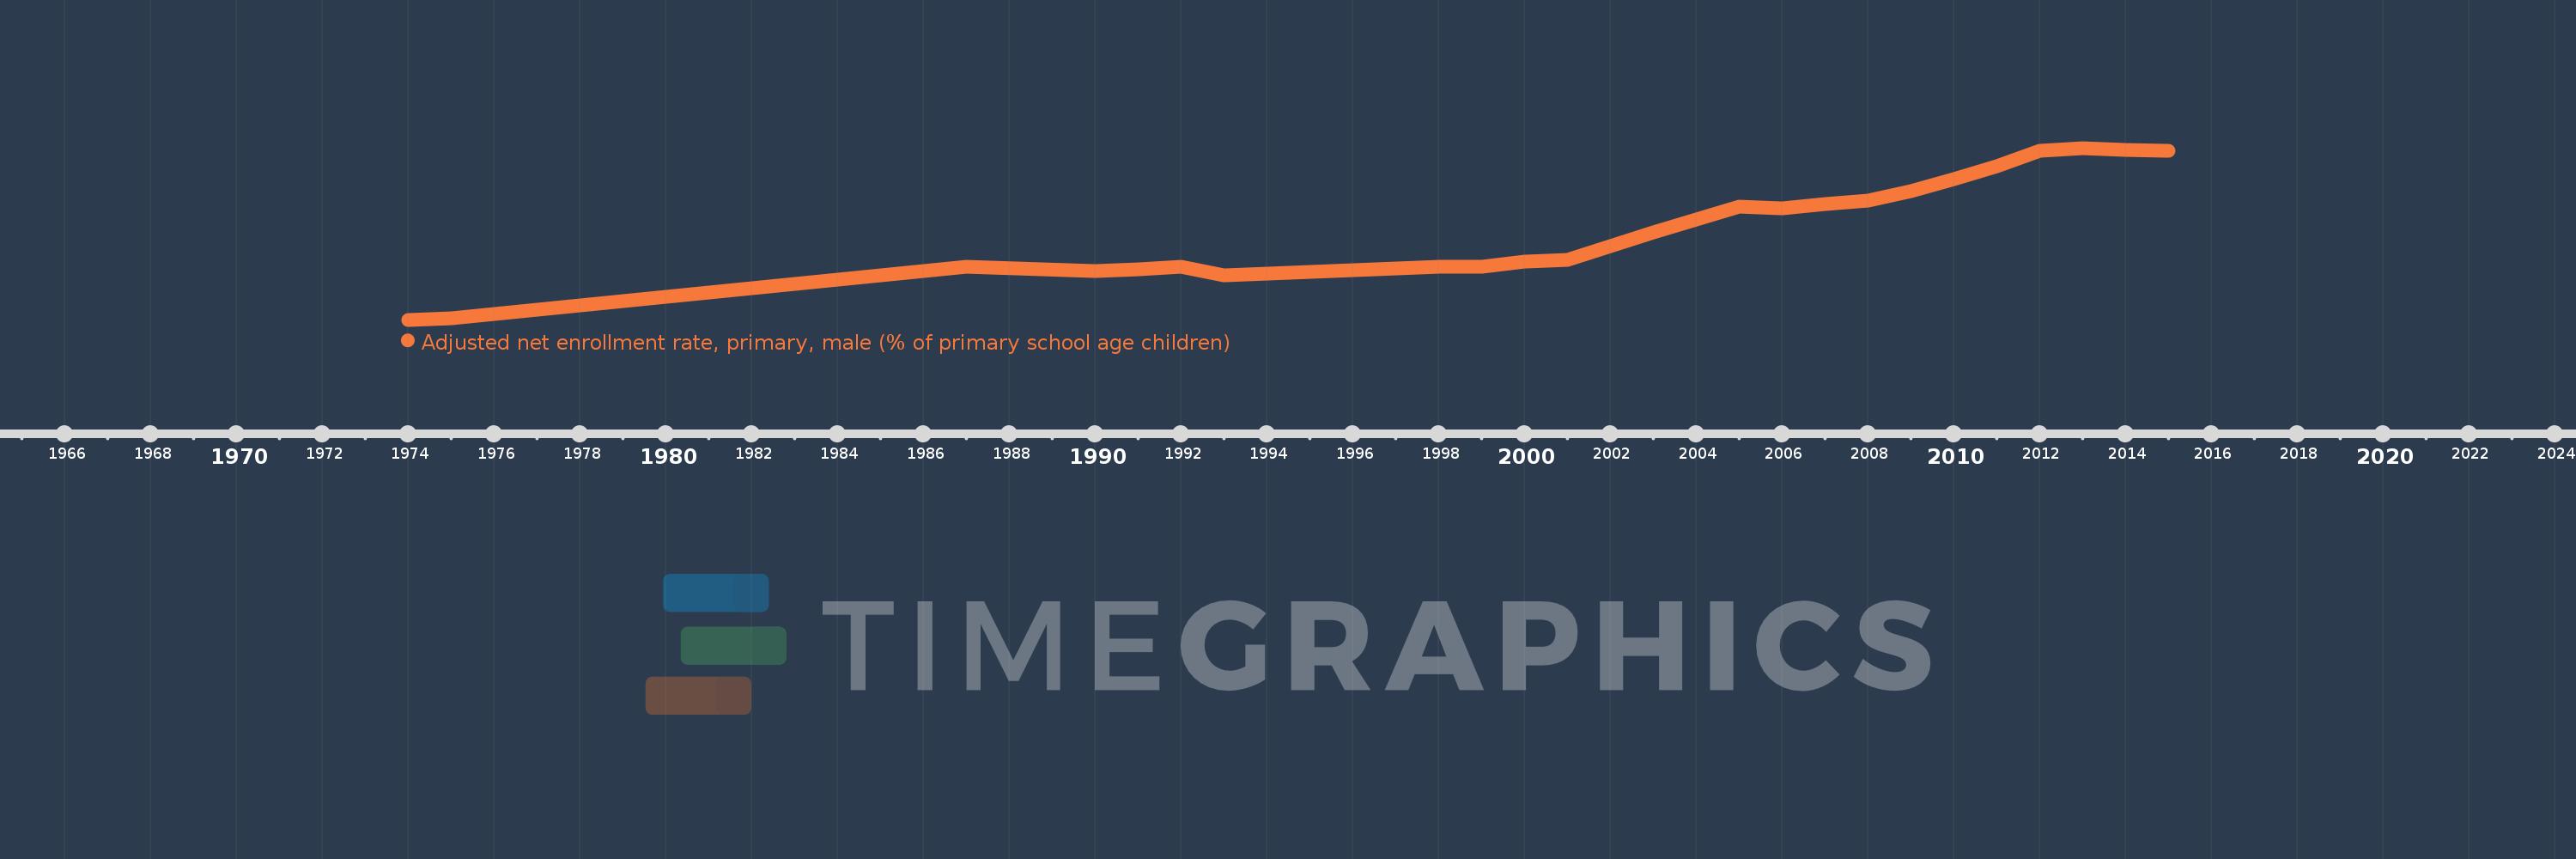
Niger
NER
true
2
1
Adjusted net enrollment rate, primary, male (% of primary school age children)
2015,2014,2013,2012,2011,2010,2009,2008,2007,2006,2005,2004,2003,2002,2001,2000,1999,1998,1993,1992,1991,1990,1987,1975,1974