33
/
AIzaSyB4mHJ5NPEv-XzF7P6NDYXjlkCWaeKw5bc
November 30, 2025
209929
Nicaragua
NIC
true
2
1
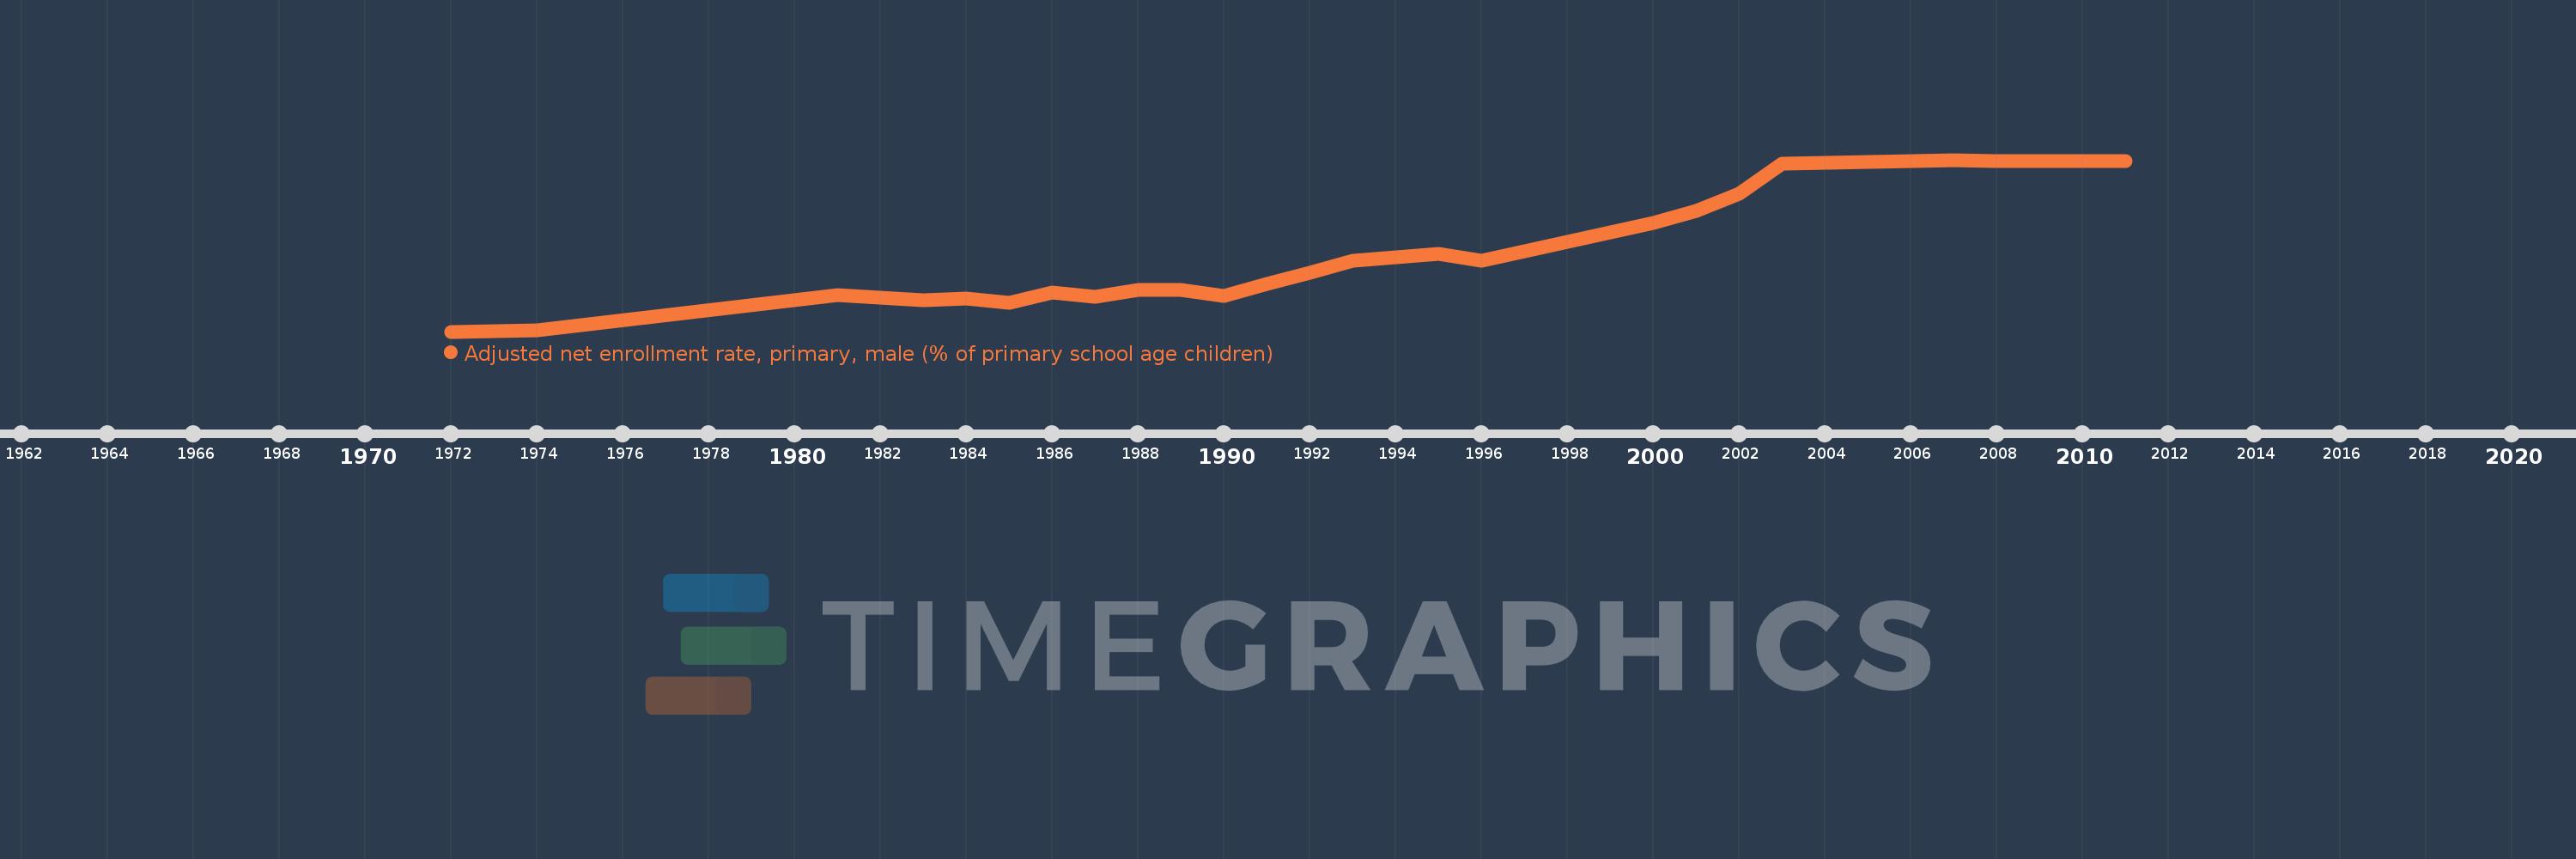
Adjusted net enrollment rate, primary, male (% of primary school age children)
2011,2008,2007,2003,2002,2001,2000,1996,1995,1994,1993,1992,1991,1990,1989,1988,1987,1986,1985,1984,1983,1981,1974,1972