33
/
AIzaSyB4mHJ5NPEv-XzF7P6NDYXjlkCWaeKw5bc
November 30, 2025
207954
Netherlands
NLD
true
2
1
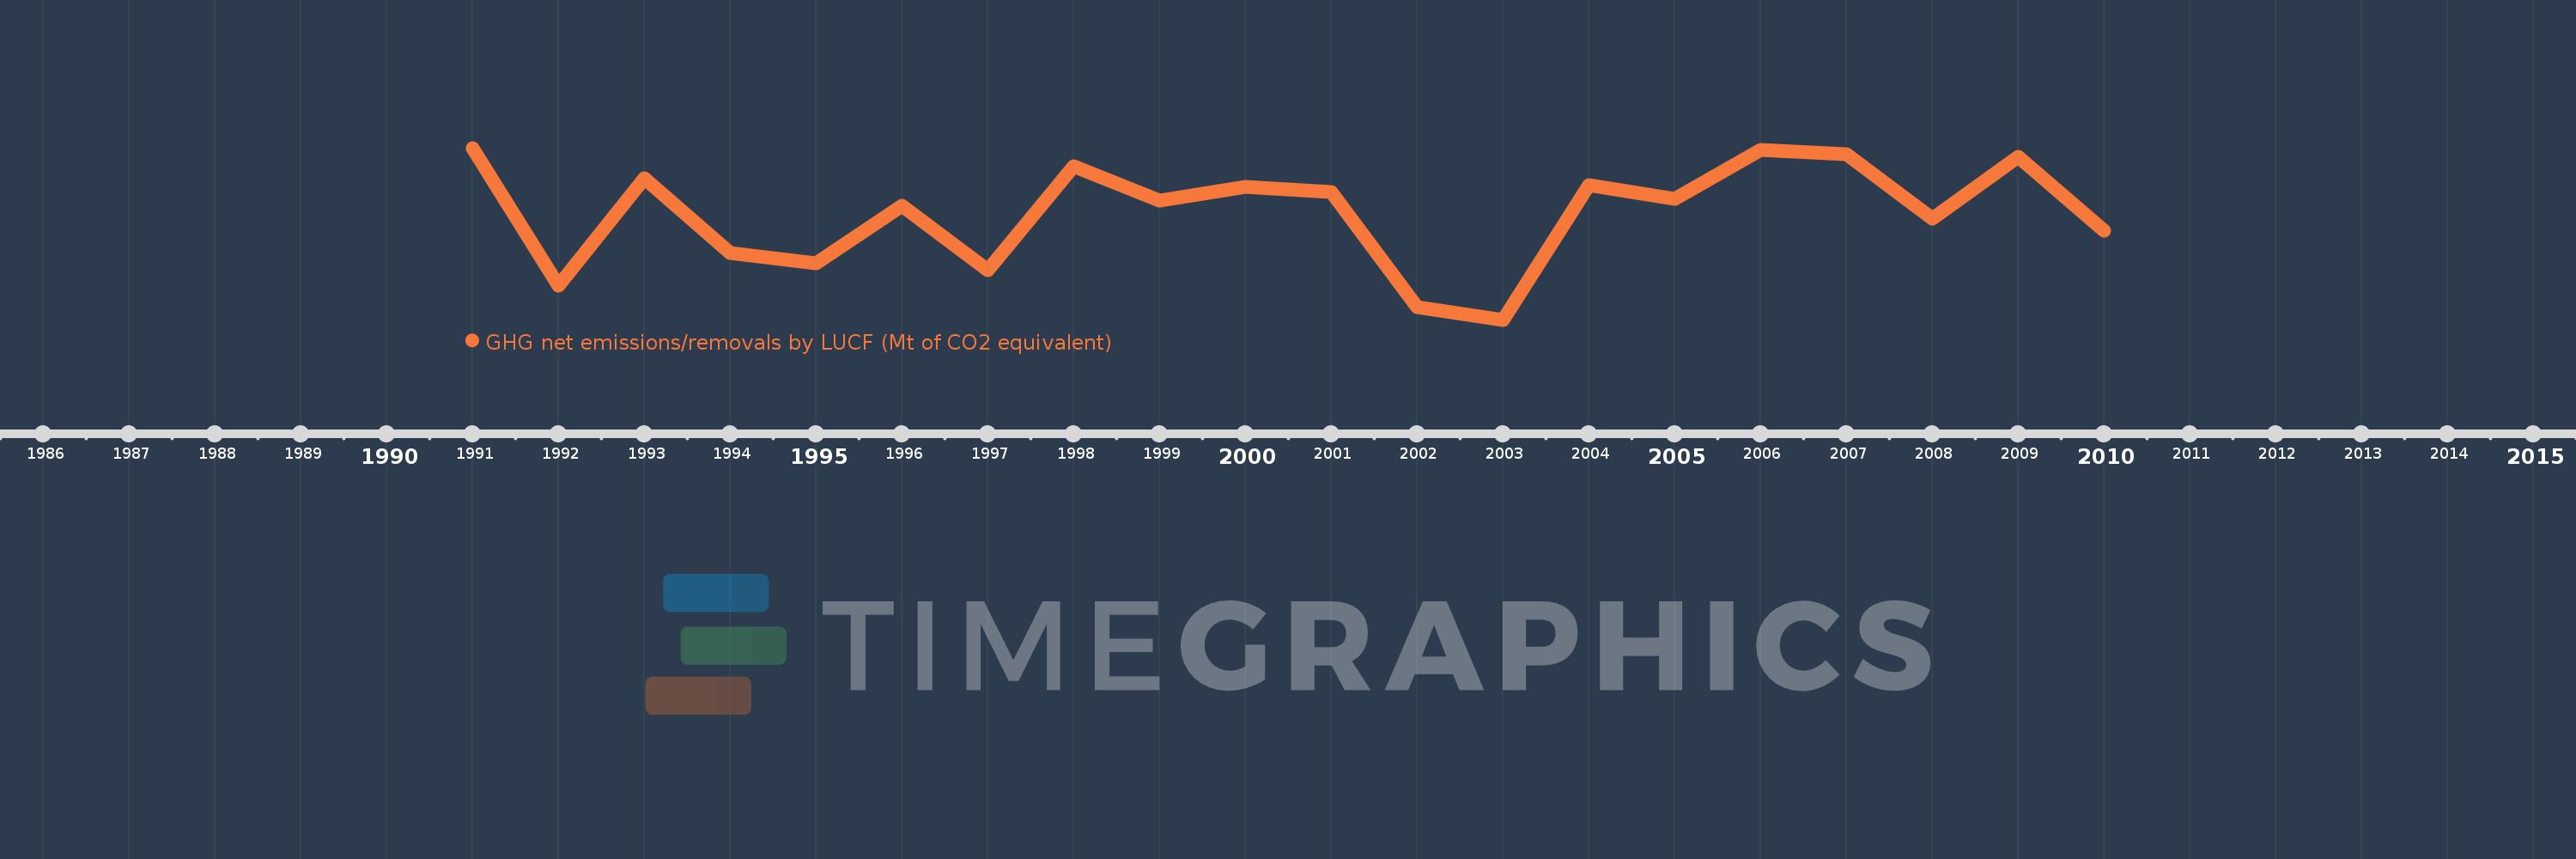
GHG net emissions/removals by LUCF (Mt of CO2 equivalent)
2010,2009,2008,2007,2006,2005,2004,2003,2002,2001,2000,1999,1998,1997,1996,1995,1994,1993,1992,1991