33
/
AIzaSyB4mHJ5NPEv-XzF7P6NDYXjlkCWaeKw5bc
November 30, 2025
141823
Greece
GRC
true
2
1
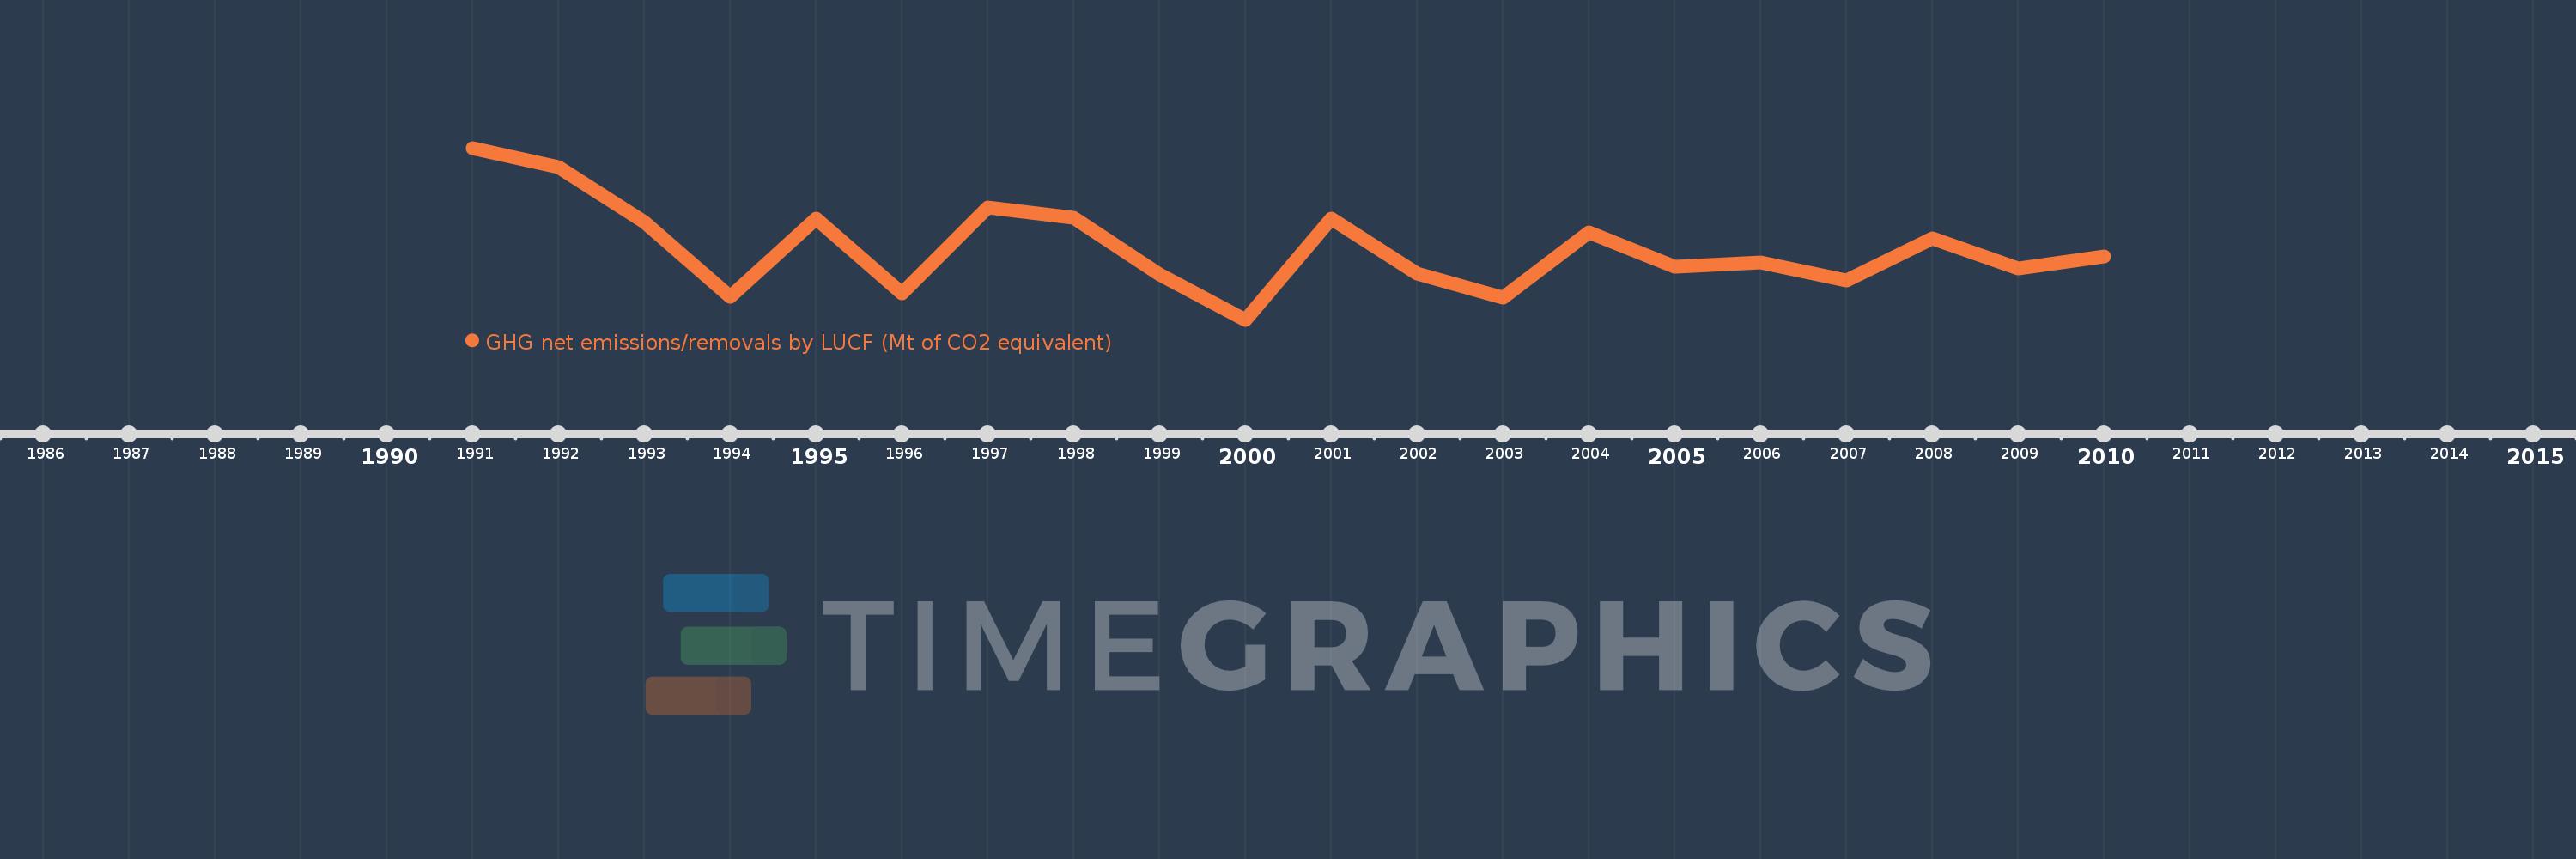
GHG net emissions/removals by LUCF (Mt of CO2 equivalent)
2010,2009,2008,2007,2006,2005,2004,2003,2002,2001,2000,1999,1998,1997,1996,1995,1994,1993,1992,1991
Create a timeline
Public Timelines
For education
For educational institutions
For teachers
For students
Cabinet
For educational institutions
For teachers
For students
Open cabinet
FAQ
Close
Create a timeline
Public timelines
FAQ
About & Feedback
Terms
Privacy
FAQ
Support 24/7
Cabinet
Get premium
Donate
Download
Global statistics library
→
Greece
→
GHG net emissions/removals by LUCF (Mt of CO2 equivalent)
This statistics in other country:
Albania
Algeria
Antigua and Barbuda
Argentina
Australia
Austria
Azerbaijan
Bangladesh
Barbados
Belarus
Belgium
Belize
Benin
Bhutan
Bolivia
Bosnia and Herzegovina
Botswana
Brazil
Bulgaria
Burkina Faso
Burundi
Cabo Verde
Cambodia
Cameroon
Canada
Central African Republic
Chad
Chile
China
Colombia
Comoros
Congo, Dem. Rep.
Congo, Rep.
Costa Rica
Cote d'Ivoire
Croatia
Cuba
Czech Republic
Denmark
Djibouti
Dominica
Dominican Republic
Ecuador
Egypt, Arab Rep.
El Salvador
Eritrea
Estonia
Ethiopia
Fiji
Finland
France
Gabon
Gambia, The
Georgia
Germany
Ghana
Greece
Grenada
Guatemala
Guinea
Guyana
Haiti
Honduras
Hungary
Iceland
India
Indonesia
Iran, Islamic Rep.
Ireland
Israel
Italy
Jamaica
Japan
Jordan
Kenya
Korea, Dem. People’s Rep.
Korea, Rep.
Kyrgyz Republic
Lao PDR
Latvia
Lebanon
Lesotho
Liechtenstein
Lithuania
Luxembourg
Macedonia, FYR
Madagascar
Malawi
Malaysia
Mali
Malta
Mauritania
Mauritius
Mexico
Moldova
Monaco
Mongolia
Montenegro
Morocco
Mozambique
Namibia
Nauru
Nepal
Netherlands
New Zealand
Nicaragua
Niger
Nigeria
Norway
Pakistan
Panama
Papua New Guinea
Paraguay
Peru
Philippines
Poland
Portugal
Romania
Russian Federation
Rwanda
Samoa
San Marino
Sao Tome and Principe
Saudi Arabia
Senegal
Serbia
Seychelles
Slovak Republic
Slovenia
South Africa
Spain
Sri Lanka
St. Kitts and Nevis
St. Lucia
St. Vincent and the Grenadines
Sudan
Suriname
Swaziland
Sweden
Switzerland
Tajikistan
Tanzania
Thailand
Togo
Tonga
Trinidad and Tobago
Tunisia
Turkey
Turkmenistan
Uganda
Ukraine
United Arab Emirates
United Kingdom
United States
Uruguay
Uzbekistan
Vanuatu
Venezuela, RB
Vietnam
Yemen, Rep.
Zambia
Zimbabwe
Timeline:
This timeline shows a graph from
1991
to
2010
of Greece. No data until
1990
. Number of actual observations by date:
20
.
Source name:
World Development Indicators
Source organization:
United Nations Framework Convention on Climate Change.
Categories, topics:
Climate Change, Environment
Last updated:
apr 23, 2017
Indicators value changes by year
Meaning:
-2.98
Minimum:
-3.327
jan 1, 2000
Maximum:
-2.496
jan 1, 1991
At the date of observation
Value
Absolute change
Change from the previous value
jan 1, 1991
-2.496
-2.496
0.0%
jan 1, 1992
-2.589
-0.093
3.71%
jan 1, 1993
-2.856
-0.267
10.32%
jan 1, 1994
-3.216
-0.36
12.6%
jan 1, 1995
-2.839
+0.377
-11.71%
jan 1, 1996
-3.199
-0.36
12.67%
jan 1, 1997
-2.785
+0.413
-12.92%
jan 1, 1998
-2.833
-0.047
1.7%
jan 1, 1999
-3.109
-0.277
9.77%
jan 1, 2000
-3.327
-0.217
6.99%
jan 1, 2001
-2.836
+0.49
-14.74%
jan 1, 2002
-3.103
-0.267
9.4%
jan 1, 2003
-3.219
-0.116
3.74%
jan 1, 2004
-2.904
+0.315
-9.79%
jan 1, 2005
-3.071
-0.167
5.76%
jan 1, 2006
-3.051
+0.02
-0.64%
jan 1, 2007
-3.139
-0.087
2.86%
jan 1, 2008
-2.934
+0.205
-6.53%
jan 1, 2009
-3.079
-0.146
4.96%
jan 1, 2010
-3.019
+0.061
-1.97%
Ranking of countries by current statistics by years
About & Feedback
Terms
Privacy
FAQ
Support 24/7
Cabinet
Get premium
Donate
The service accepts bank transfer (ACH, Wire) or cards (Visa, MasterCard, etc). Processed by Stripe.
Secured with SSL