33
/
AIzaSyB4mHJ5NPEv-XzF7P6NDYXjlkCWaeKw5bc
November 30, 2025
203905
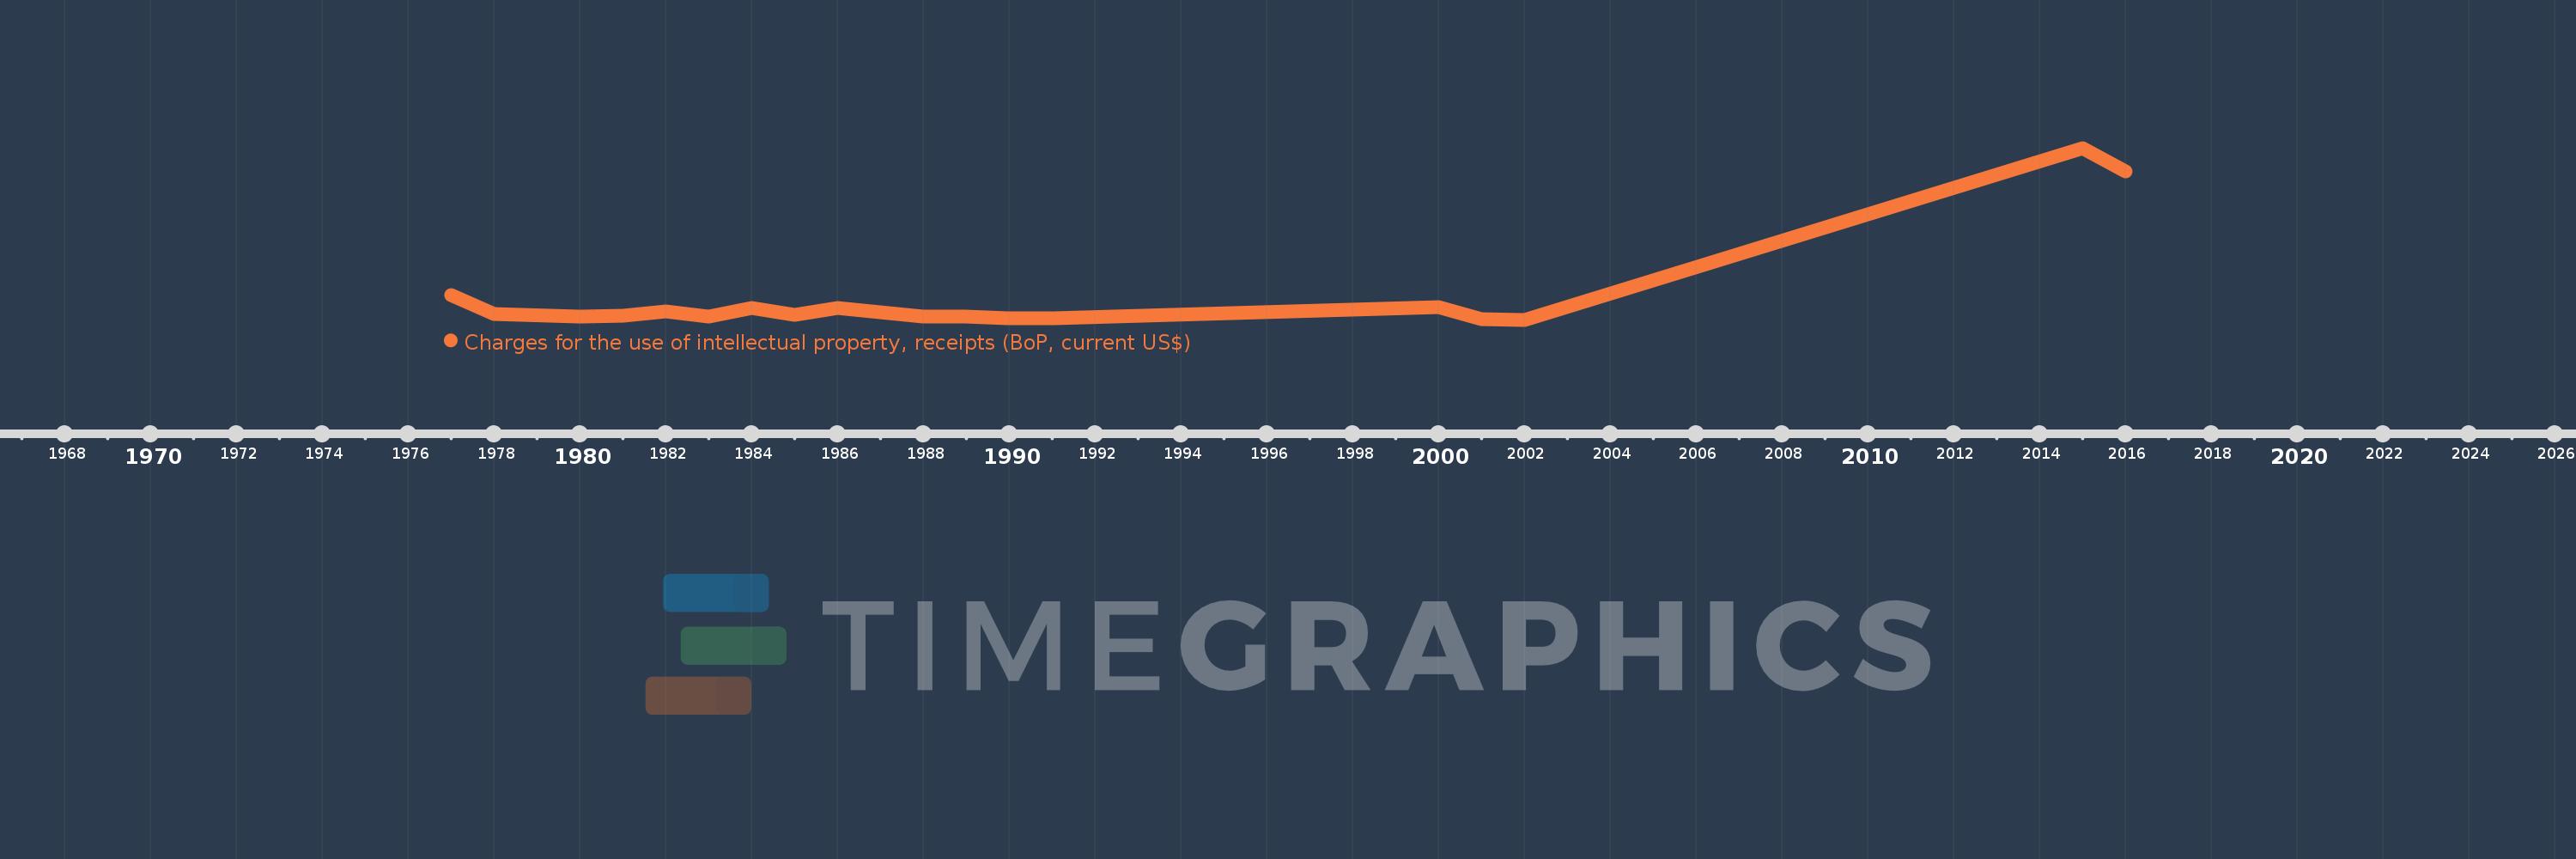
Myanmar
MMR
true
2
1
Charges for the use of intellectual property, receipts (BoP, current US$)
2016,2015,2002,2001,2000,1991,1990,1989,1988,1986,1985,1984,1983,1982,1981,1980,1978,1977