Download This statistics in other country:
Timeline:
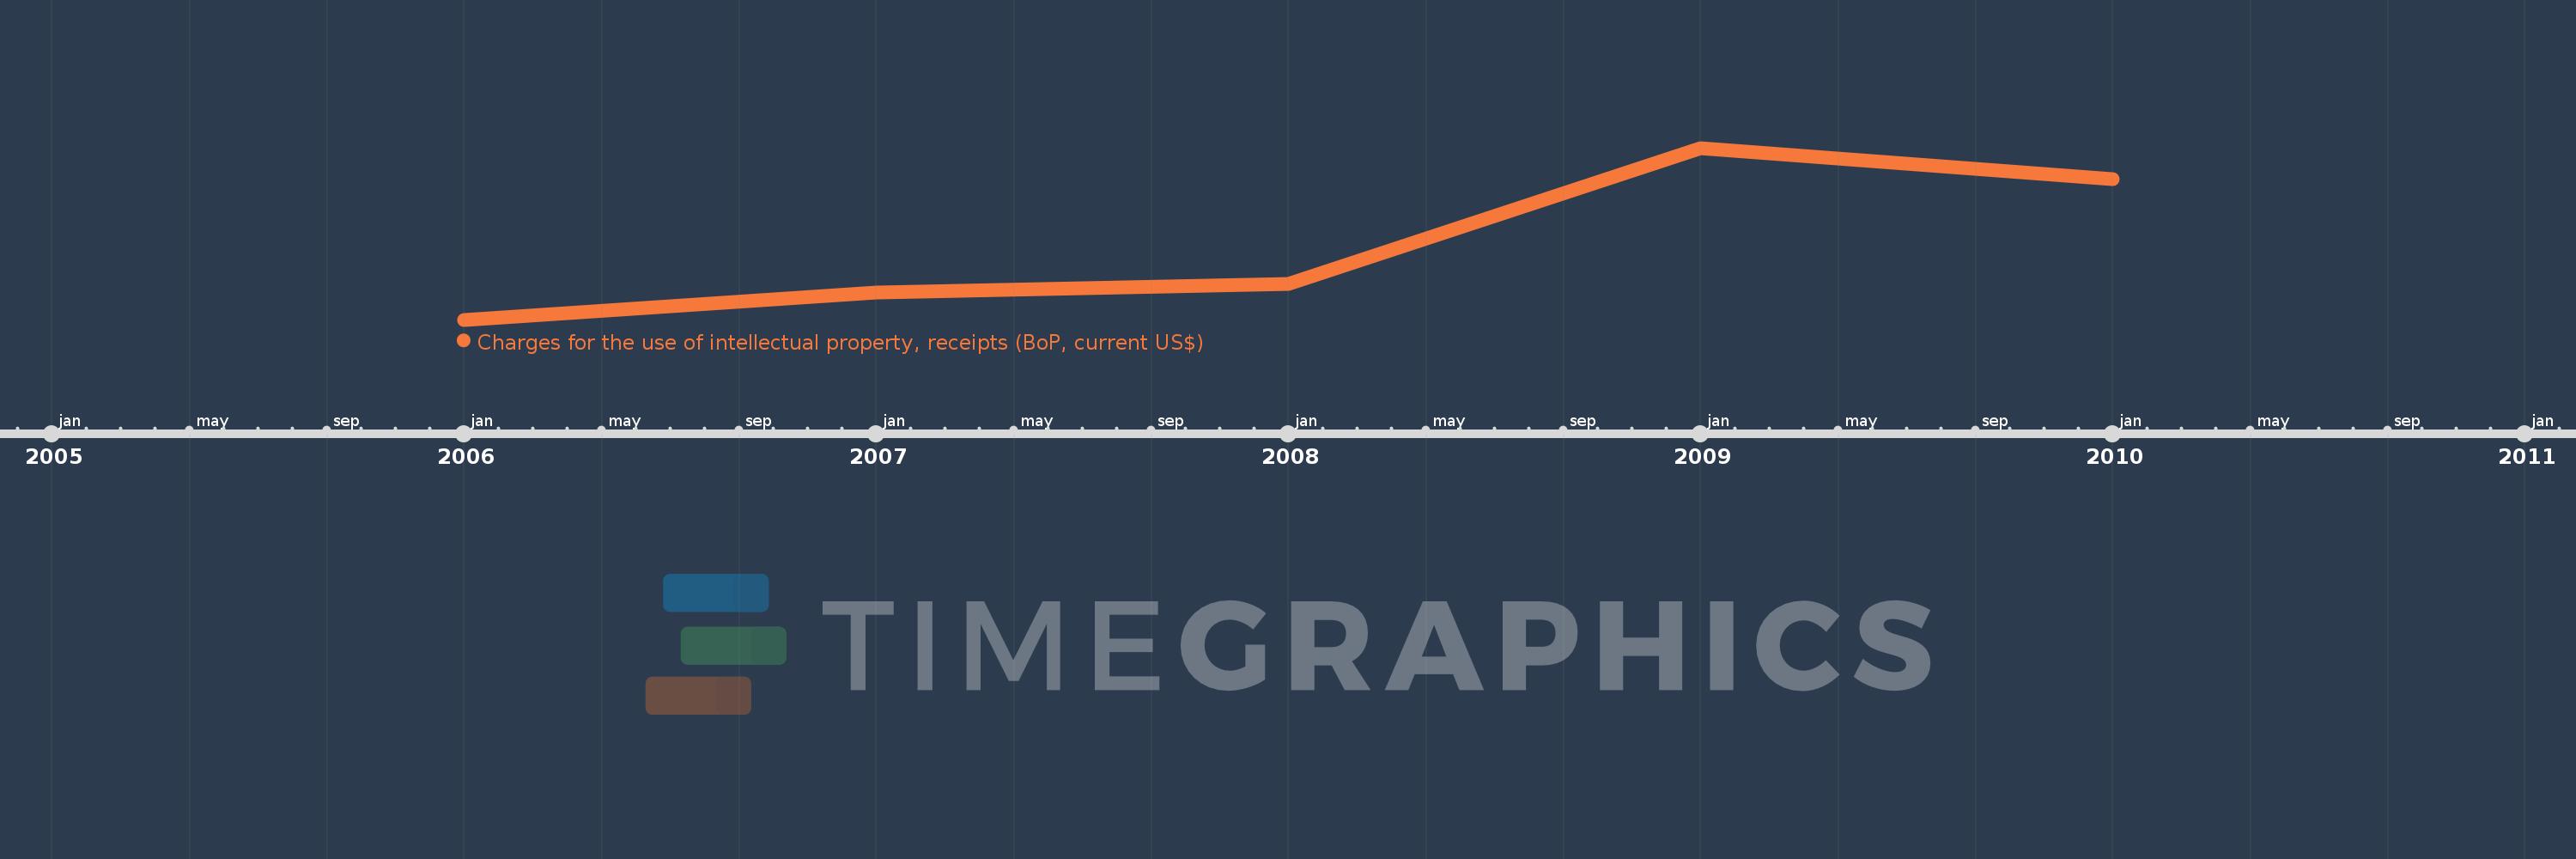
This timeline shows a graph from 2006 to 2010 of Congo, Dem. Rep.. No data until 2005. Number of actual observations by date: 5.
Source name:
World Development Indicators
Source organization:
International Monetary Fund, Balance of Payments Statistics Yearbook and data files.
Categories, topics:
Economy & Growth, Science & Technology
Last updated:
apr 23, 2017
Indicators value changes by year
Minimum:
35.2 mln
jan 1, 2006
Maximum:
125.0 mln
jan 1, 2009
At the date of observation
Value
Absolute change
Change from the previous value
jan 1, 2006
35.2 mln
+35.2 mln
0.0%
jan 1, 2007
49.6 mln
+14.4 mln
40.91%
jan 1, 2008
53.8 mln
+4.2 mln
8.47%
jan 1, 2009
125.0 mln
+71.2 mln
132.34%
jan 1, 2010
108.5 mln
-16.5 mln
-13.2%
Ranking of countries by current statistics by years