Download This statistics in other country:
Timeline:
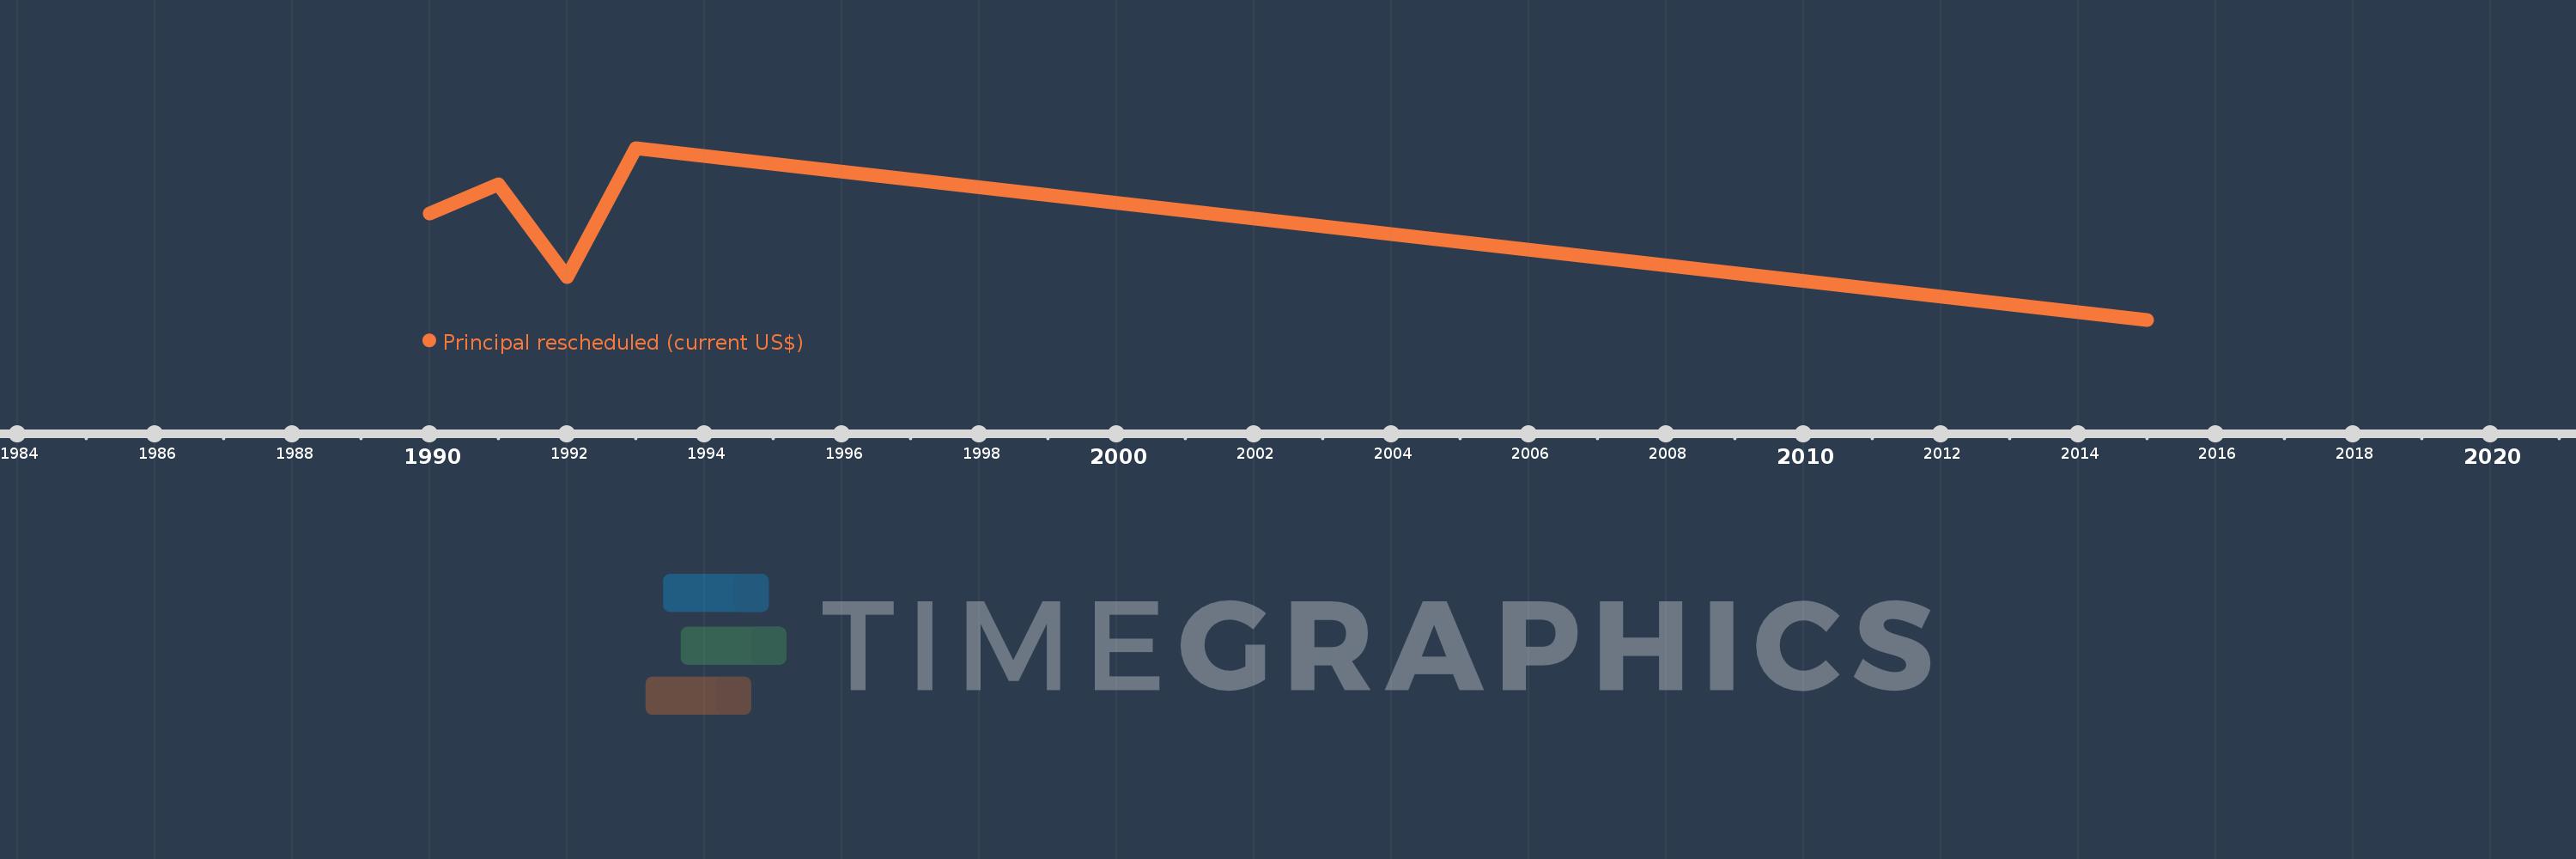
This timeline shows a graph from 1990 to 2015 of Morocco. No data until 1989. Number of actual observations by date: 5.
Source name:
World Development Indicators
Source organization:
World Bank, International Debt Statistics.
Categories, topics:
External Debt
Last updated:
apr 23, 2017
Indicators value changes by year
Maximum:
748.442 mln
jan 1, 1993
At the date of observation
Value
Absolute change
Change from the previous value
jan 1, 1990
461.568 mln
+461.568 mln
0.0%
jan 1, 1991
590.374 mln
+128.806 mln
27.91%
jan 1, 1992
185.803 mln
-404.571 mln
-68.53%
jan 1, 1993
748.442 mln
+562.639 mln
302.81%
jan 1, 2015
0.0
-748.442 mln
-100.0%
Ranking of countries by current statistics by years