Download This statistics in other country:
Timeline:
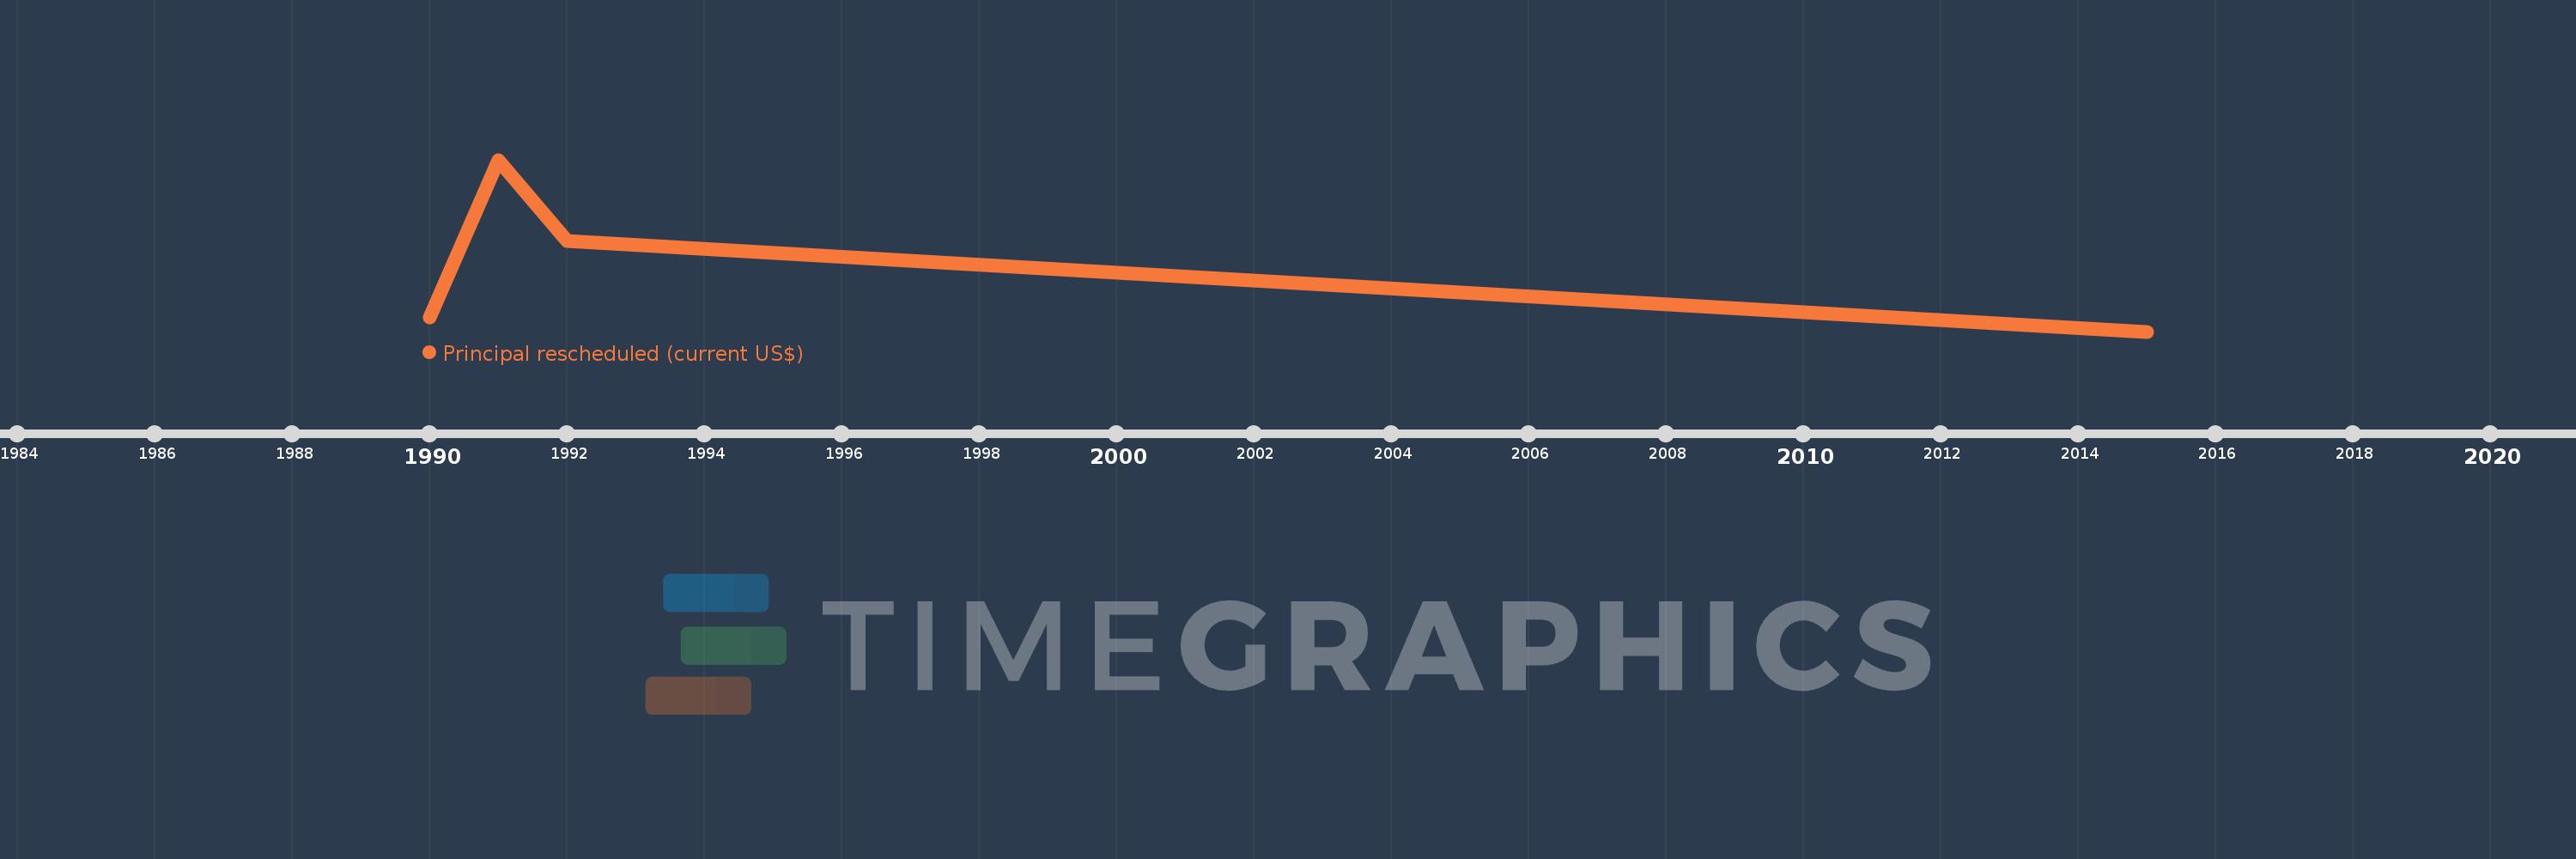
This timeline shows a graph from 1990 to 2015 of El Salvador. No data until 1989. Number of actual observations by date: 4.
Source name:
World Development Indicators
Source organization:
World Bank, International Debt Statistics.
Categories, topics:
External Debt
Last updated:
apr 23, 2017
Indicators value changes by year
Maximum:
41.734 mln
jan 1, 1991
At the date of observation
Value
Absolute change
Change from the previous value
jan 1, 1990
3.426 mln
+3.426 mln
0.0%
jan 1, 1991
41.734 mln
+38.308 mln
1.12K%
jan 1, 1992
22.086 mln
-19.648 mln
-47.08%
jan 1, 2015
0.0
-22.086 mln
-100.0%
Ranking of countries by current statistics by years