33
/
AIzaSyB4mHJ5NPEv-XzF7P6NDYXjlkCWaeKw5bc
November 30, 2025
182726
Macao SAR, China
MAC
true
2
1
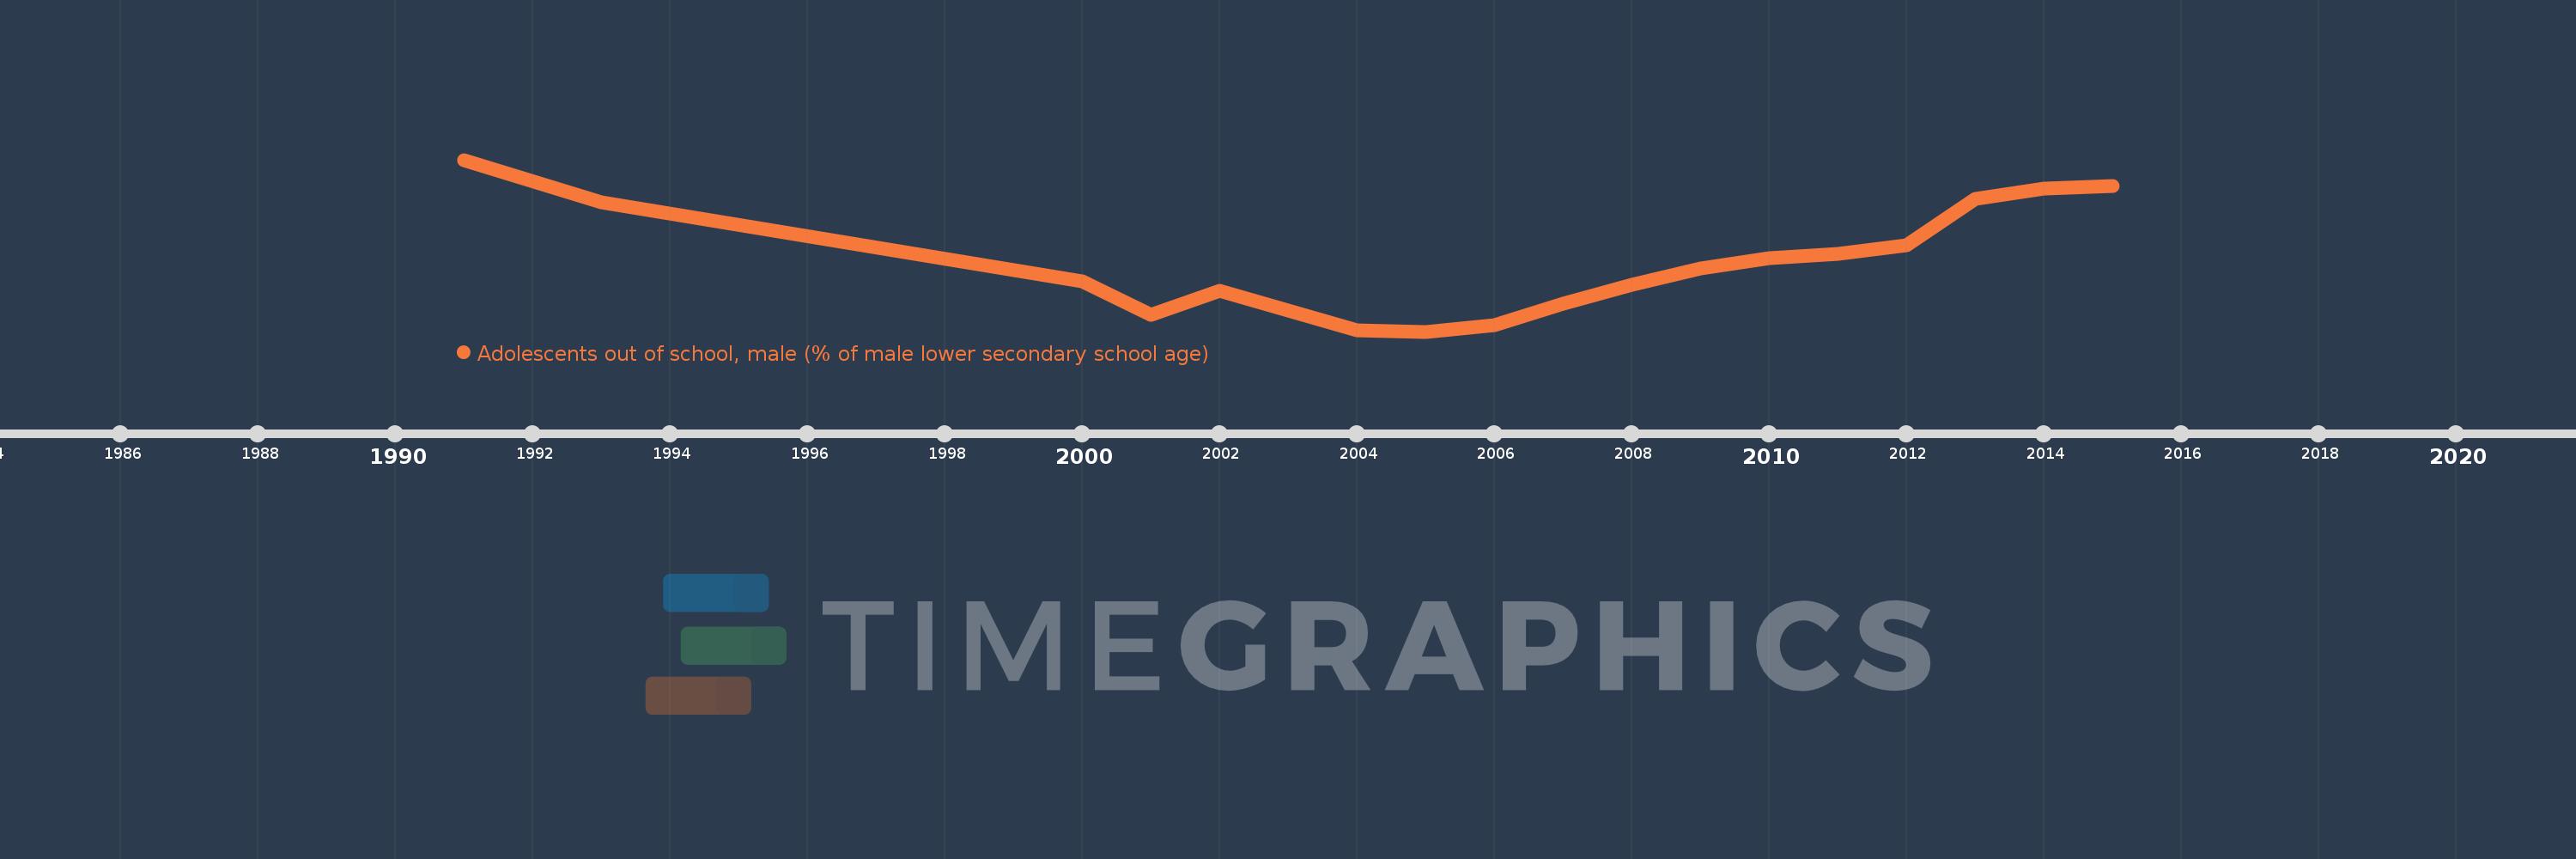
Adolescents out of school, male (% of male lower secondary school age)
2015,2014,2013,2012,2011,2010,2009,2008,2007,2006,2005,2004,2002,2001,2000,1993,1991