33
/
AIzaSyB4mHJ5NPEv-XzF7P6NDYXjlkCWaeKw5bc
November 30, 2025
169612
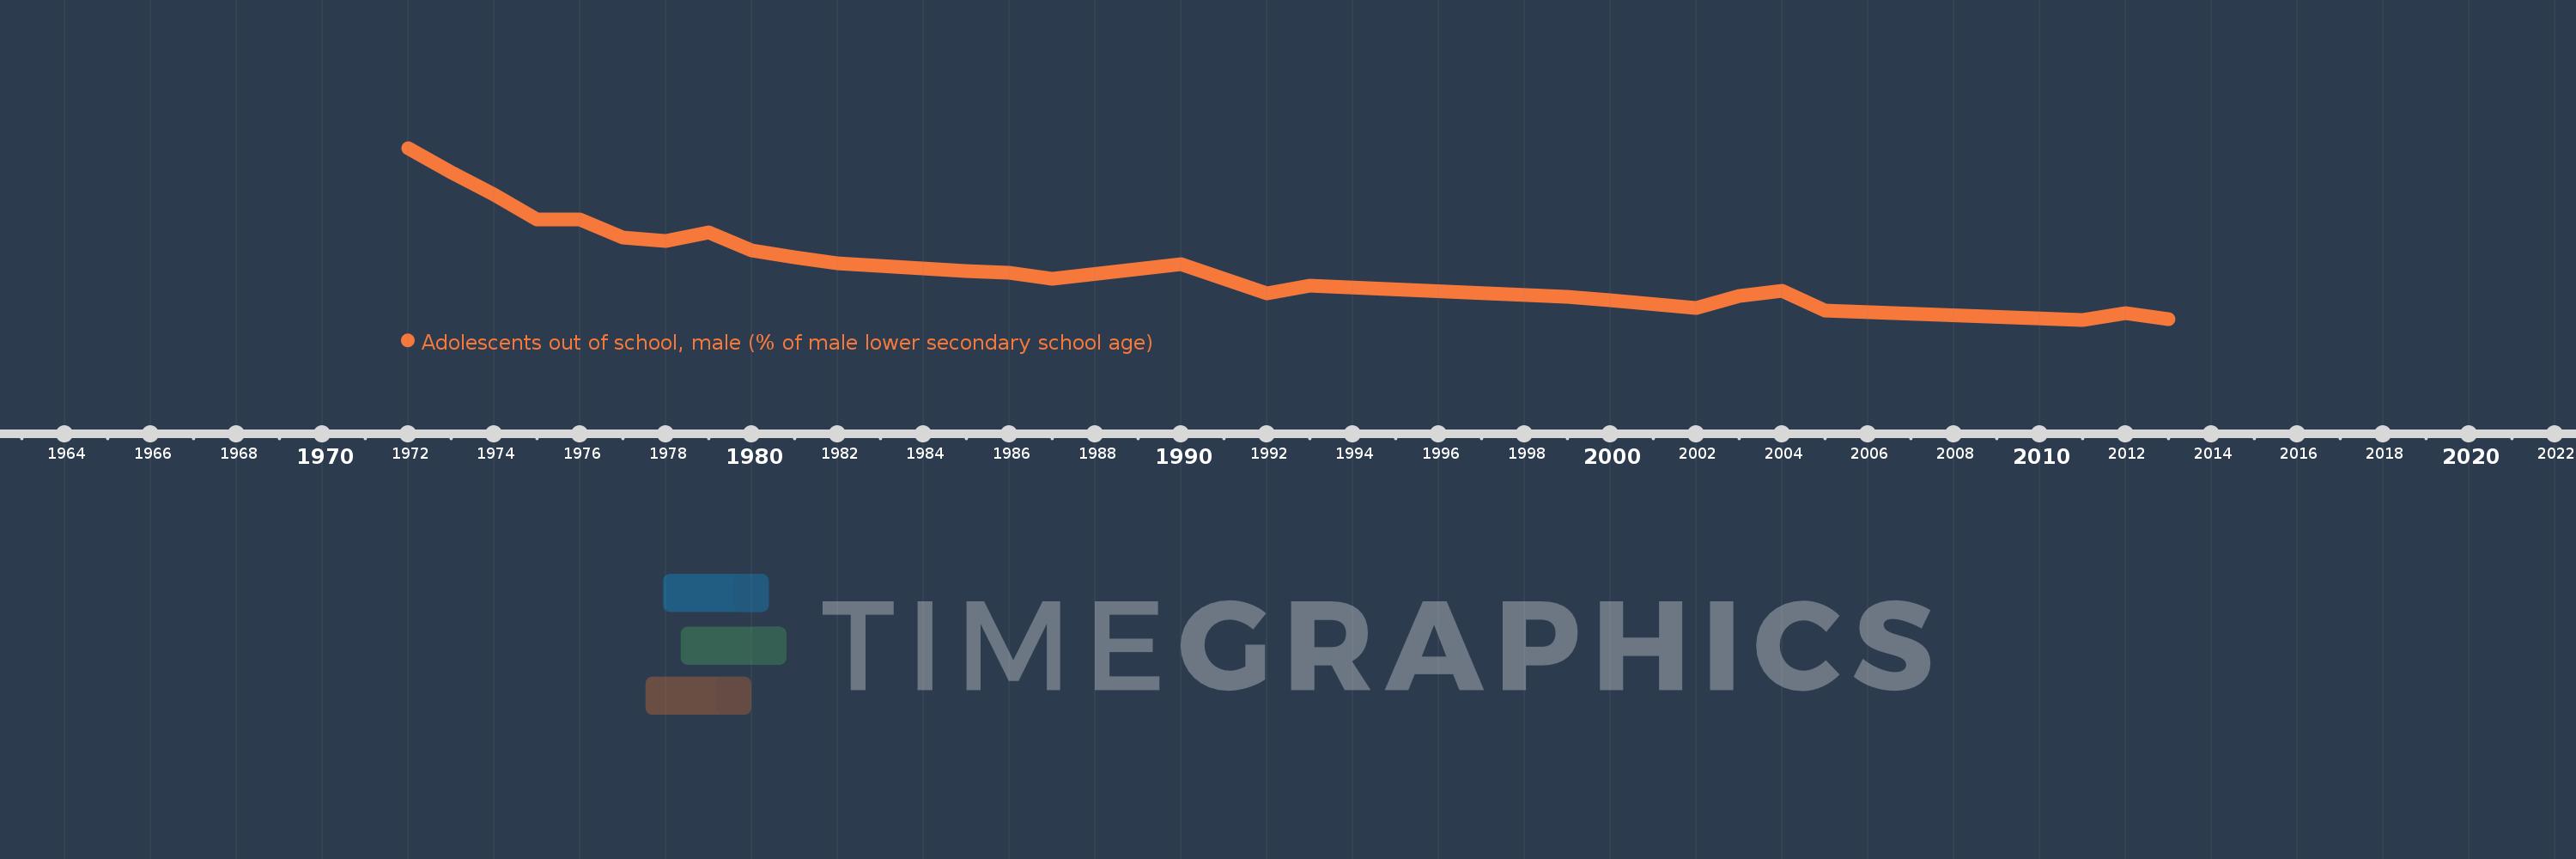
Korea, Rep.
KOR
true
2
1
Adolescents out of school, male (% of male lower secondary school age)
2013,2012,2011,2005,2004,2003,2002,2000,1999,1993,1992,1990,1987,1986,1985,1982,1981,1980,1979,1978,1977,1976,1975,1974,1973,1972