Download This statistics in other country:
Timeline:
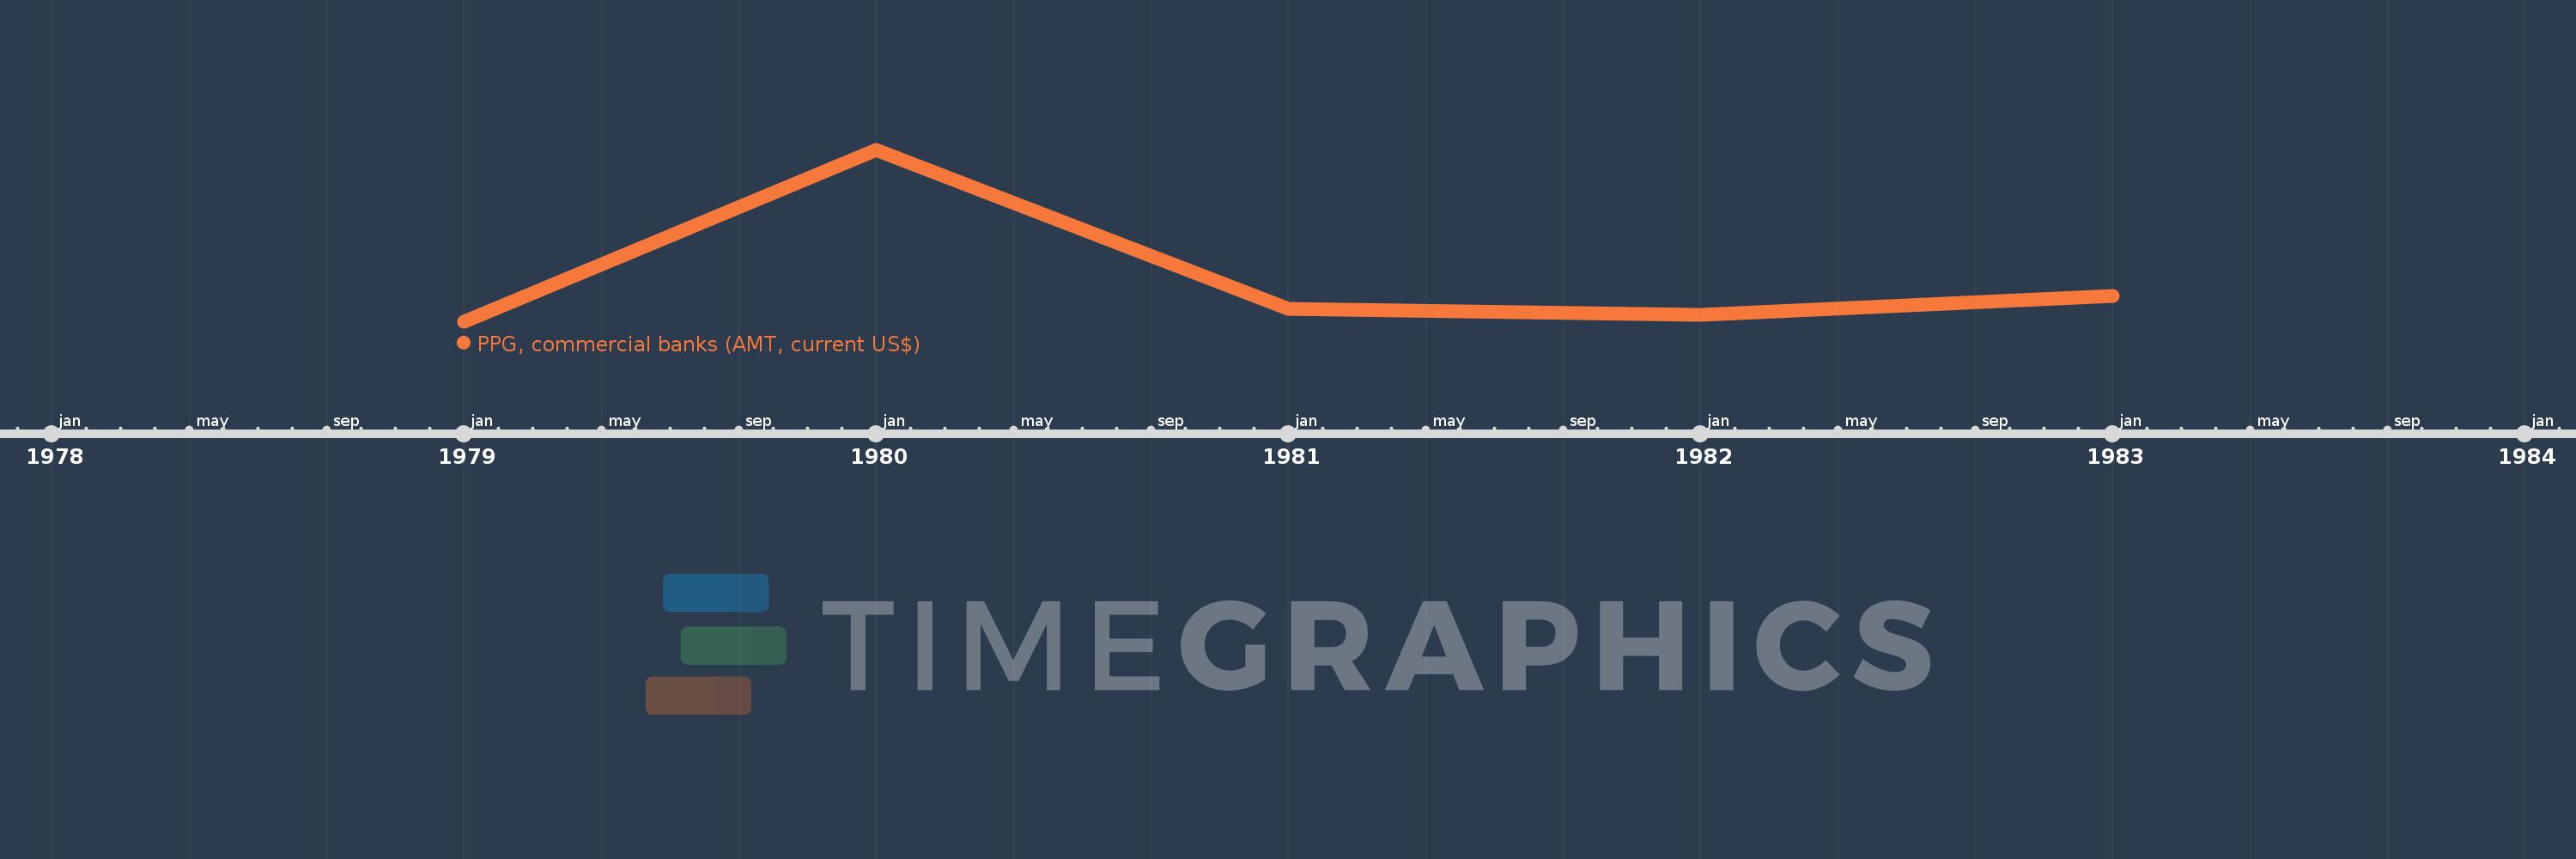
This timeline shows a graph from 1979 to 1983 of Liberia. No data until 1978. Number of actual observations by date: 5.
Source name:
World Development Indicators
Source organization:
World Bank, International Debt Statistics.
Categories, topics:
External Debt
Last updated:
apr 23, 2017
Indicators value changes by year
Minimum:
577.0K
jan 1, 1979
Maximum:
31.154 mln
jan 1, 1980
At the date of observation
Value
Absolute change
Change from the previous value
jan 1, 1979
577.0K
+577.0K
0.0%
jan 1, 1980
31.154 mln
+30.577 mln
5.3K%
jan 1, 1981
2.888 mln
-28.266 mln
-90.73%
jan 1, 1982
1.837 mln
-1.051 mln
-36.39%
jan 1, 1983
5.236 mln
+3.399 mln
185.03%
Ranking of countries by current statistics by years