33
/
AIzaSyB4mHJ5NPEv-XzF7P6NDYXjlkCWaeKw5bc
November 30, 2025
137222
Gambia, The
GMB
true
2
1
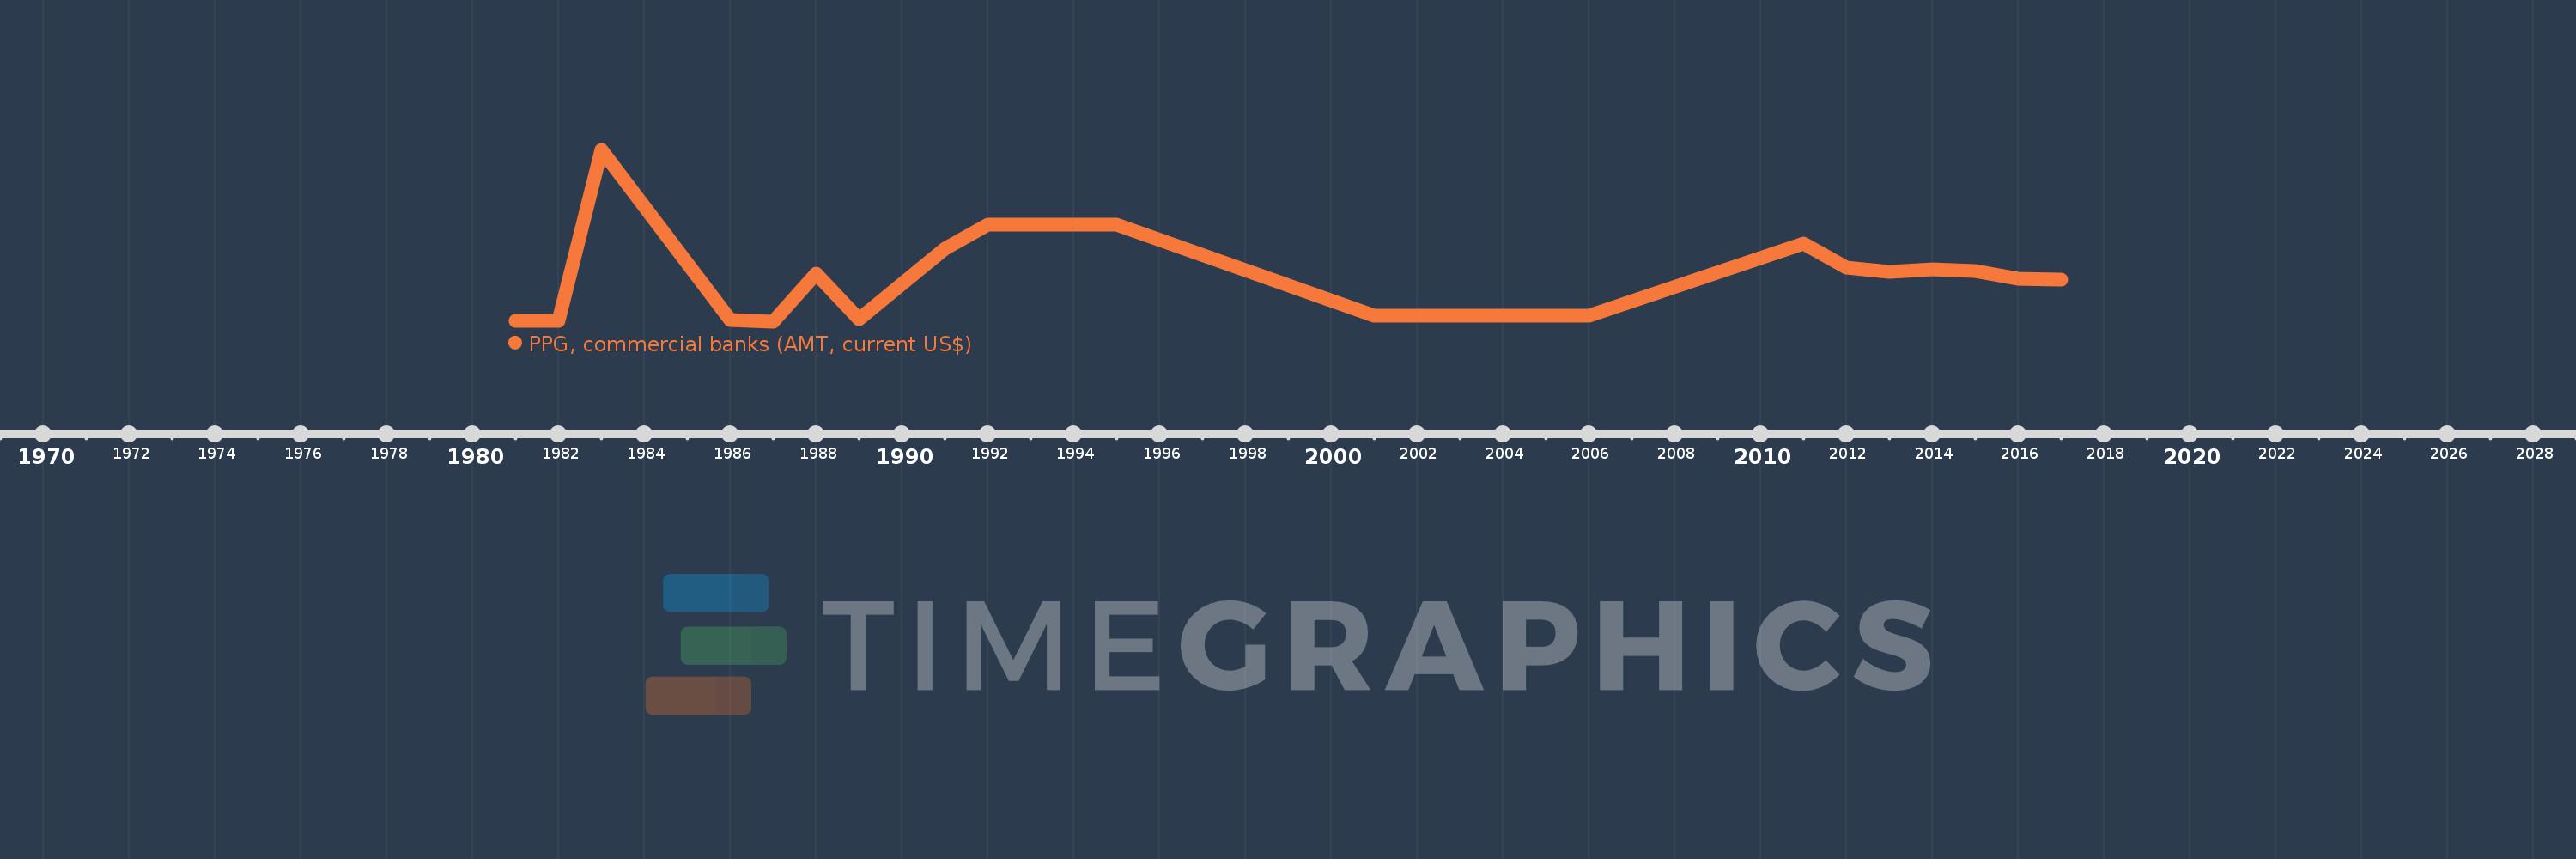
PPG, commercial banks (AMT, current US$)
2017,2016,2015,2014,2013,2012,2011,2006,2005,2002,2001,1995,1994,1993,1992,1991,1989,1988,1987,1986,1983,1982,1981