Download This statistics in other country:
Timeline:
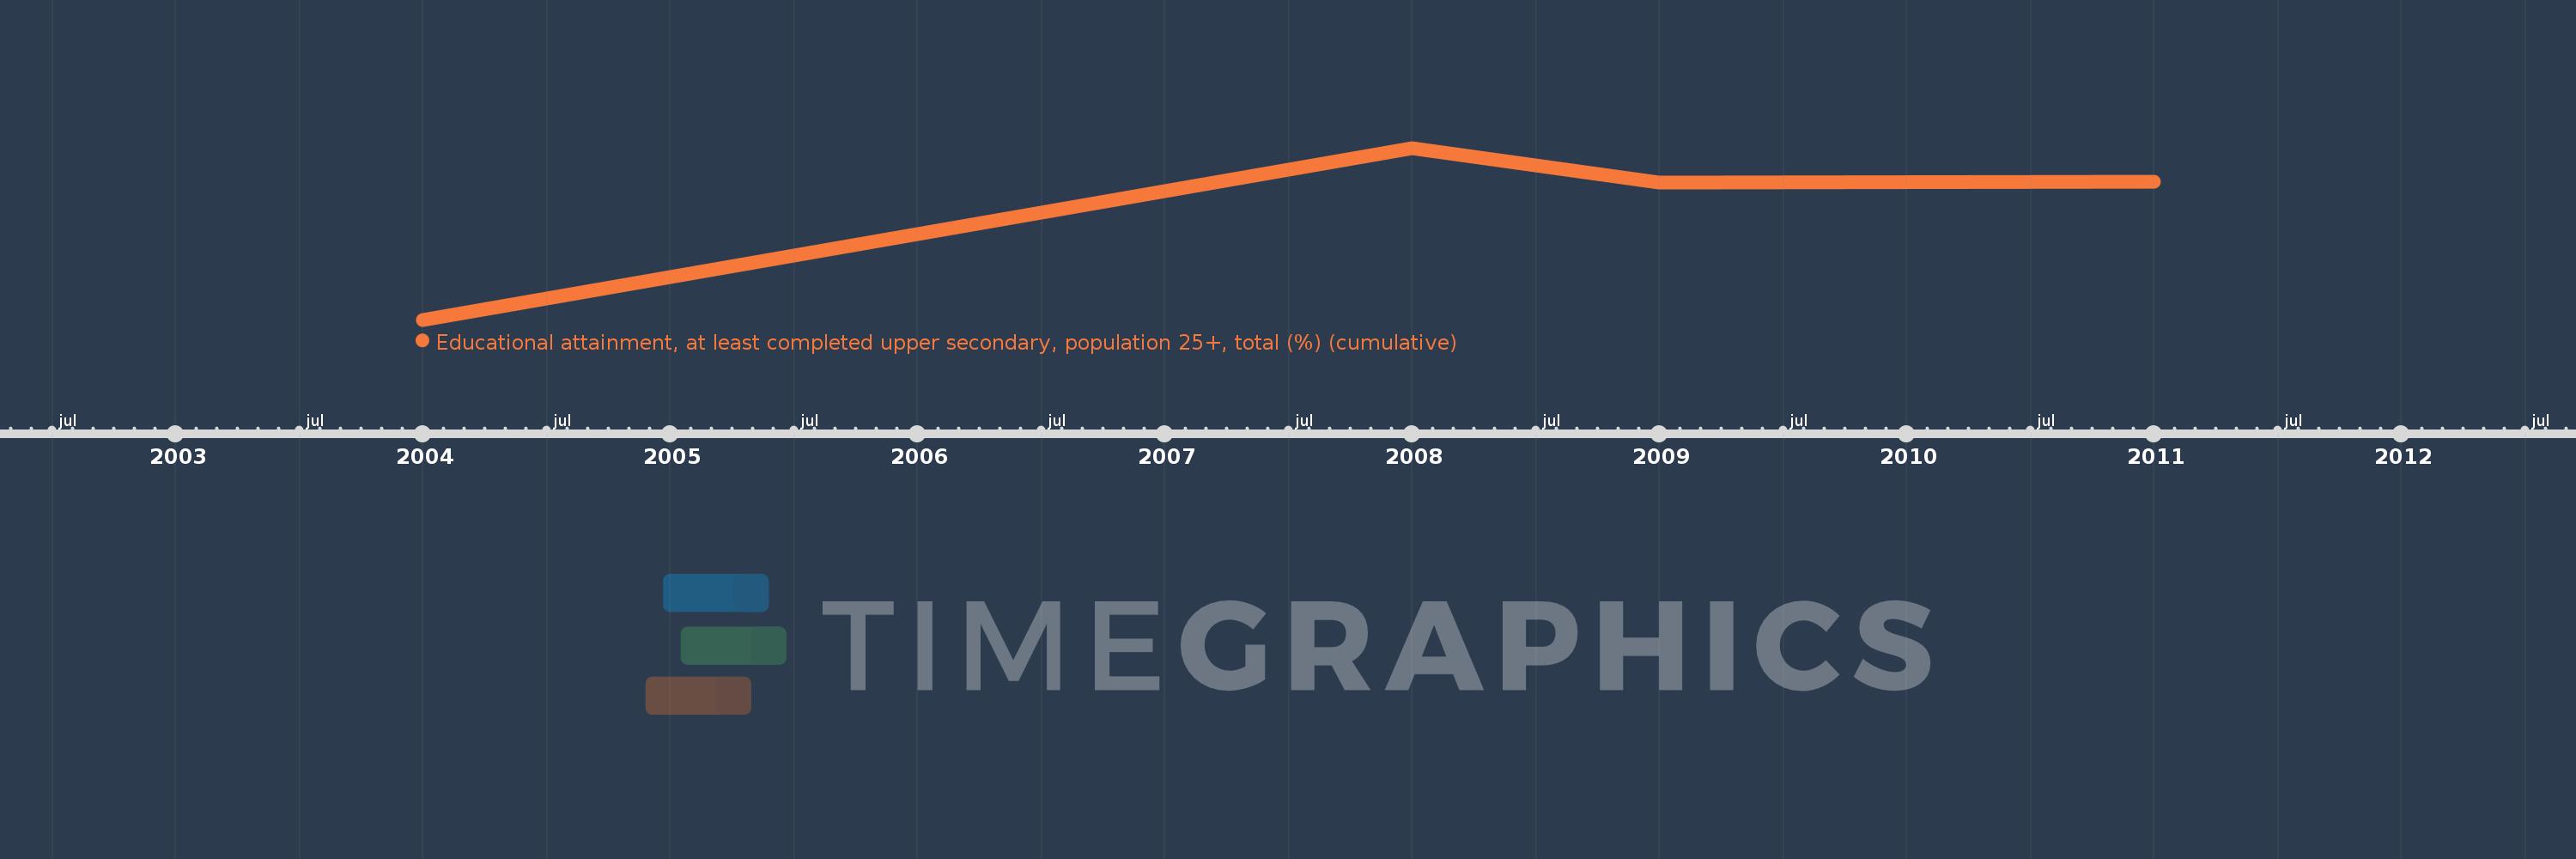
This timeline shows a graph from 2004 to 2011 of Jordan. No data until 2003. Number of actual observations by date: 4.
Source name:
World Development Indicators
Source organization:
United Nations Educational, Scientific, and Cultural Organization (UNESCO) Institute for Statistics.
Categories, topics:
Education, Gender
Last updated:
apr 23, 2017
Indicators value changes by year
Maximum:
51.154
jan 1, 2008
At the date of observation
Value
Absolute change
Change from the previous value
jan 1, 2004
1.409
+1.409
0.0%
jan 1, 2008
51.154
+49.744
3.53K%
jan 1, 2009
41.049
-10.104
-19.75%
jan 1, 2011
41.355
+0.305
0.74%
Ranking of countries by current statistics by years