Download This statistics in other country:
Timeline:
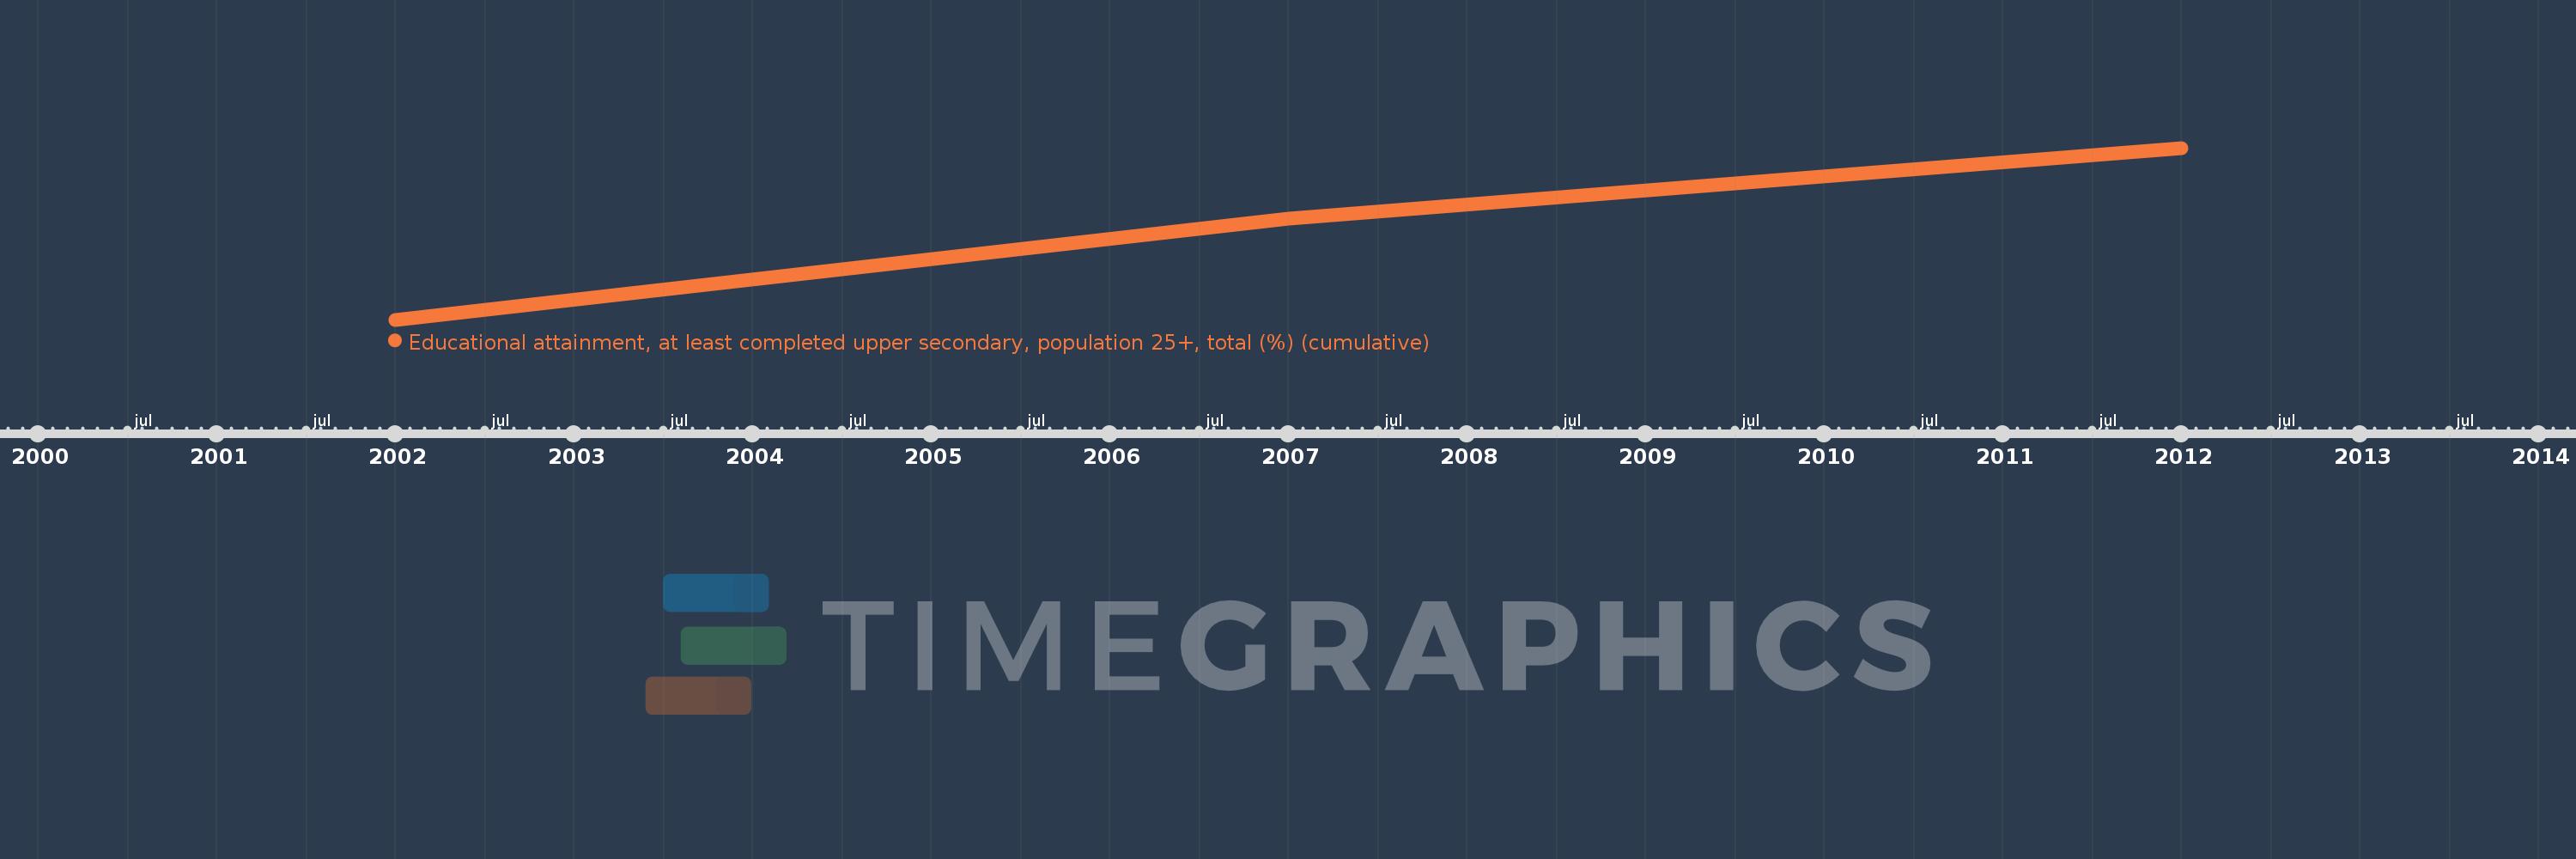
This timeline shows a graph from 2002 to 2012 of Canada. No data until 2001. Number of actual observations by date: 3.
Source name:
World Development Indicators
Source organization:
United Nations Educational, Scientific, and Cultural Organization (UNESCO) Institute for Statistics.
Categories, topics:
Education, Gender
Last updated:
apr 23, 2017
Indicators value changes by year
Minimum:
74.582
jan 1, 2002
Maximum:
82.749
jan 1, 2012
At the date of observation
Value
Absolute change
Change from the previous value
jan 1, 2002
74.582
+74.582
0.0%
jan 1, 2007
79.403
+4.822
6.47%
jan 1, 2012
82.749
+3.346
4.21%
Ranking of countries by current statistics by years