33
/
AIzaSyB4mHJ5NPEv-XzF7P6NDYXjlkCWaeKw5bc
November 30, 2025
159005
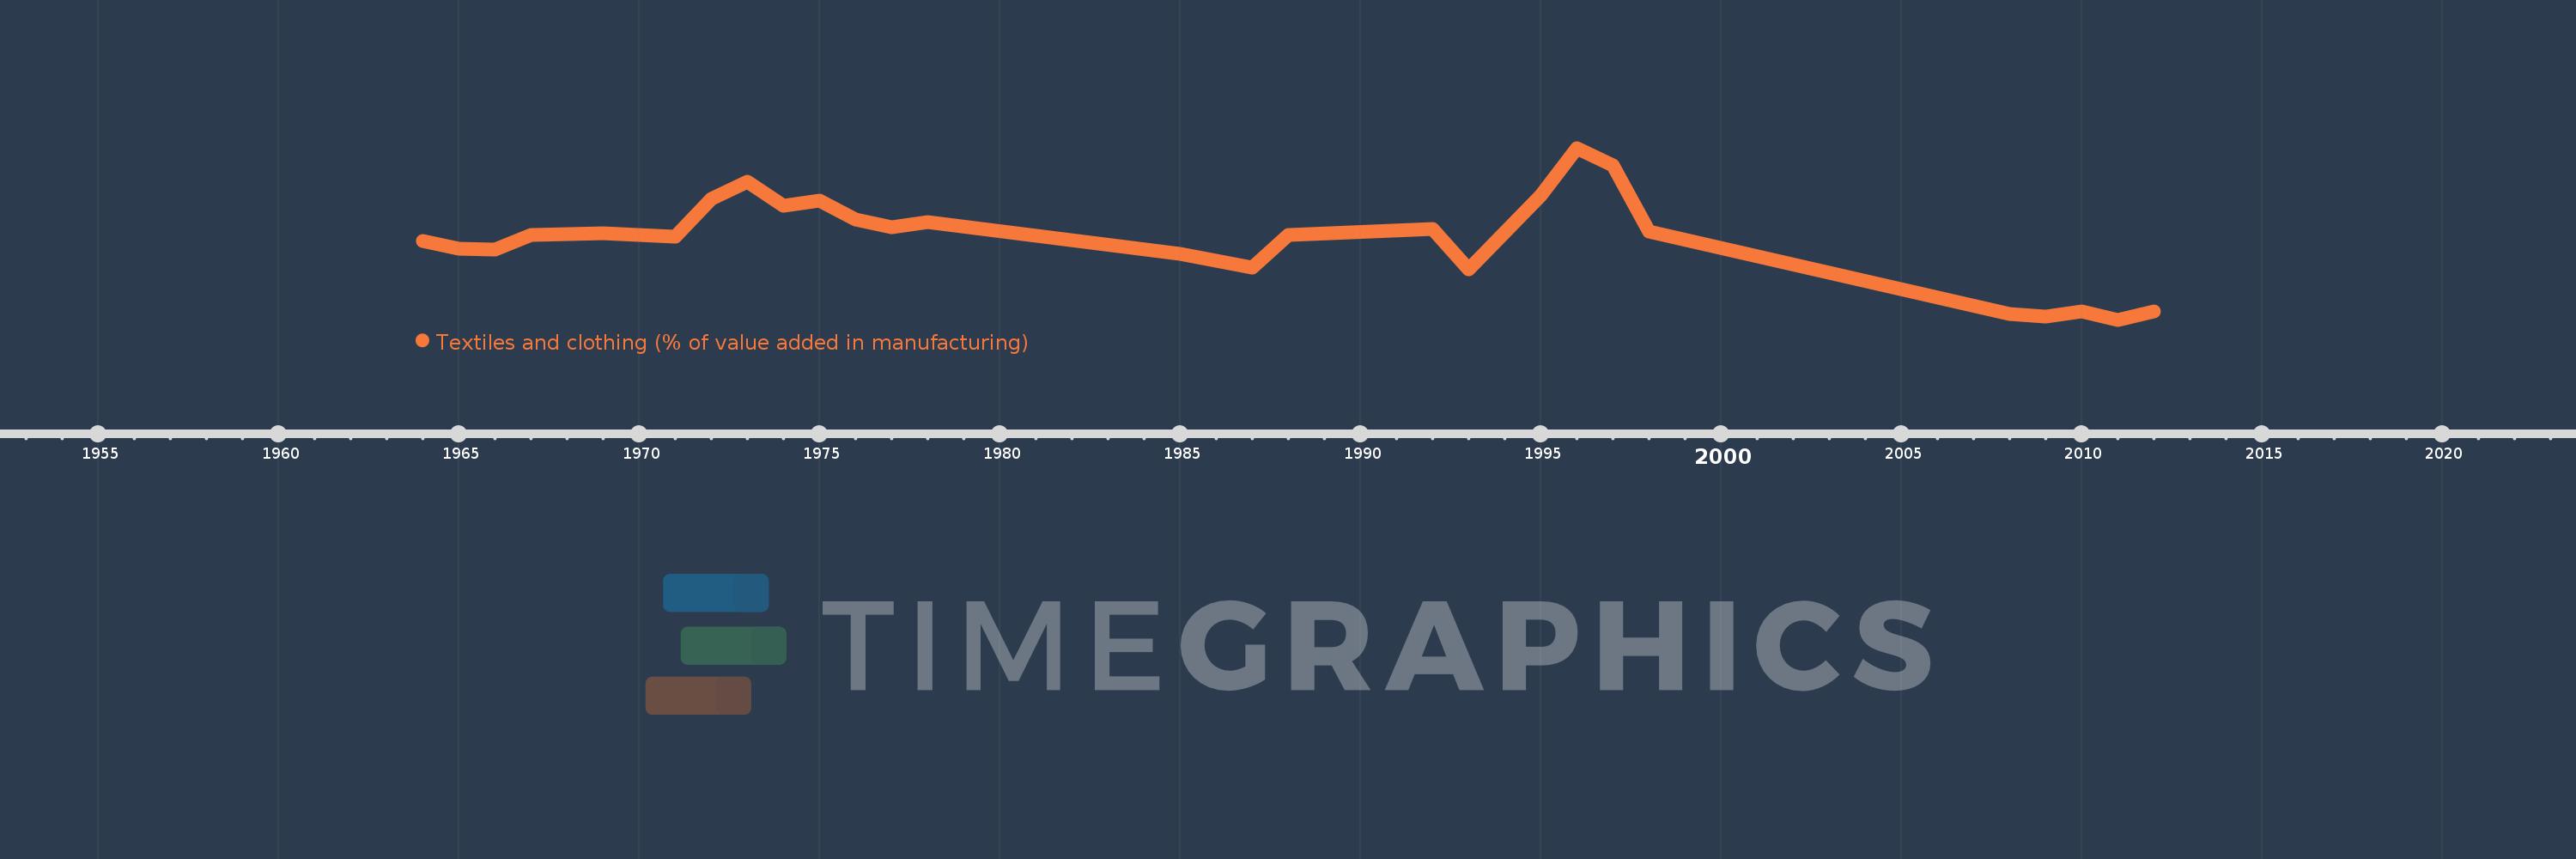
Iraq
IRQ
true
2
1
Textiles and clothing (% of value added in manufacturing)
2012,2011,2010,2009,2008,1998,1997,1996,1995,1993,1992,1988,1987,1986,1985,1978,1977,1976,1975,1974,1973,1972,1971,1970,1969,1968,1967,1966,1965,1964