33
/
AIzaSyB4mHJ5NPEv-XzF7P6NDYXjlkCWaeKw5bc
November 1, 2025
151179
Honduras
HND
true
2
1
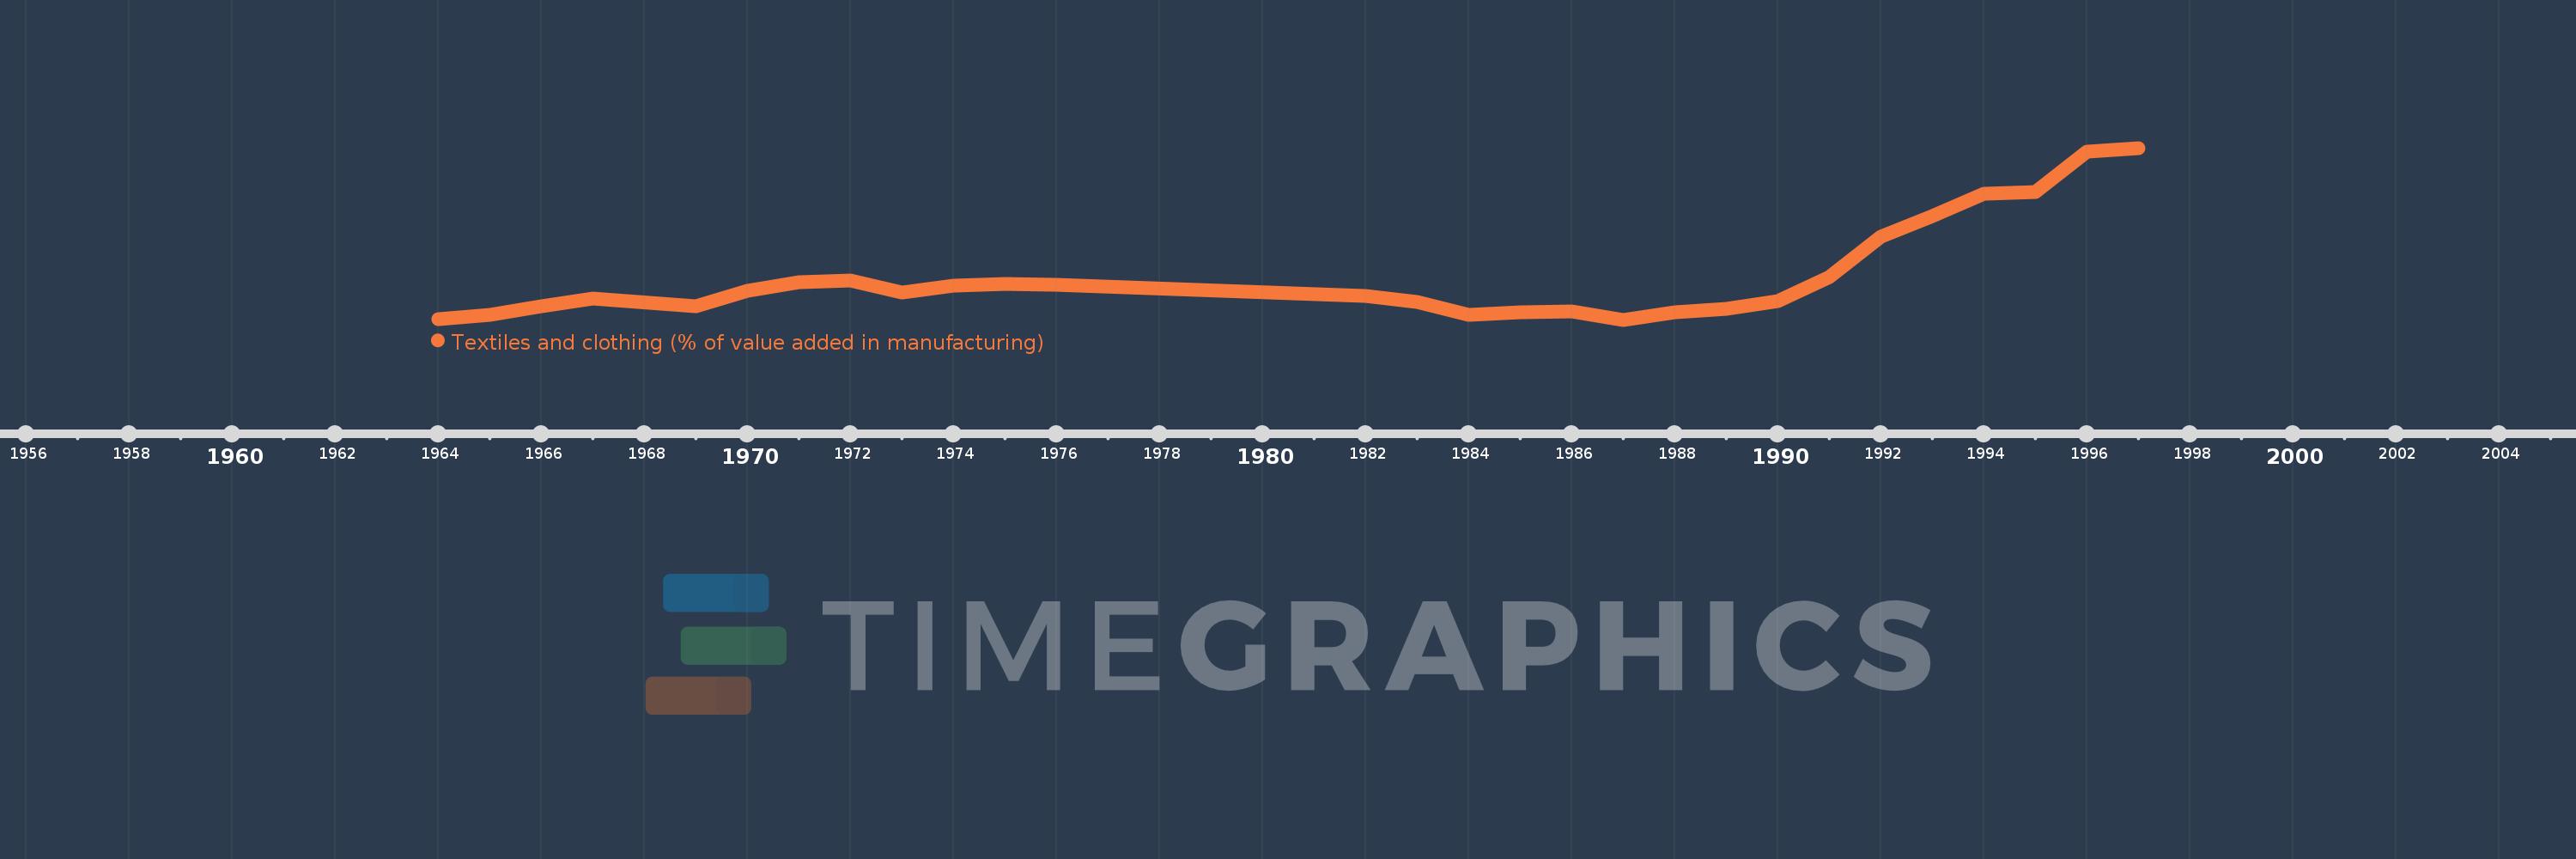
Textiles and clothing (% of value added in manufacturing)
1997,1996,1995,1994,1993,1992,1991,1990,1989,1988,1987,1986,1985,1984,1983,1982,1976,1975,1974,1973,1972,1971,1970,1969,1967,1966,1965,1964