33
/
AIzaSyB4mHJ5NPEv-XzF7P6NDYXjlkCWaeKw5bc
November 30, 2025
151907
Hong Kong SAR, China
HKG
true
2
1
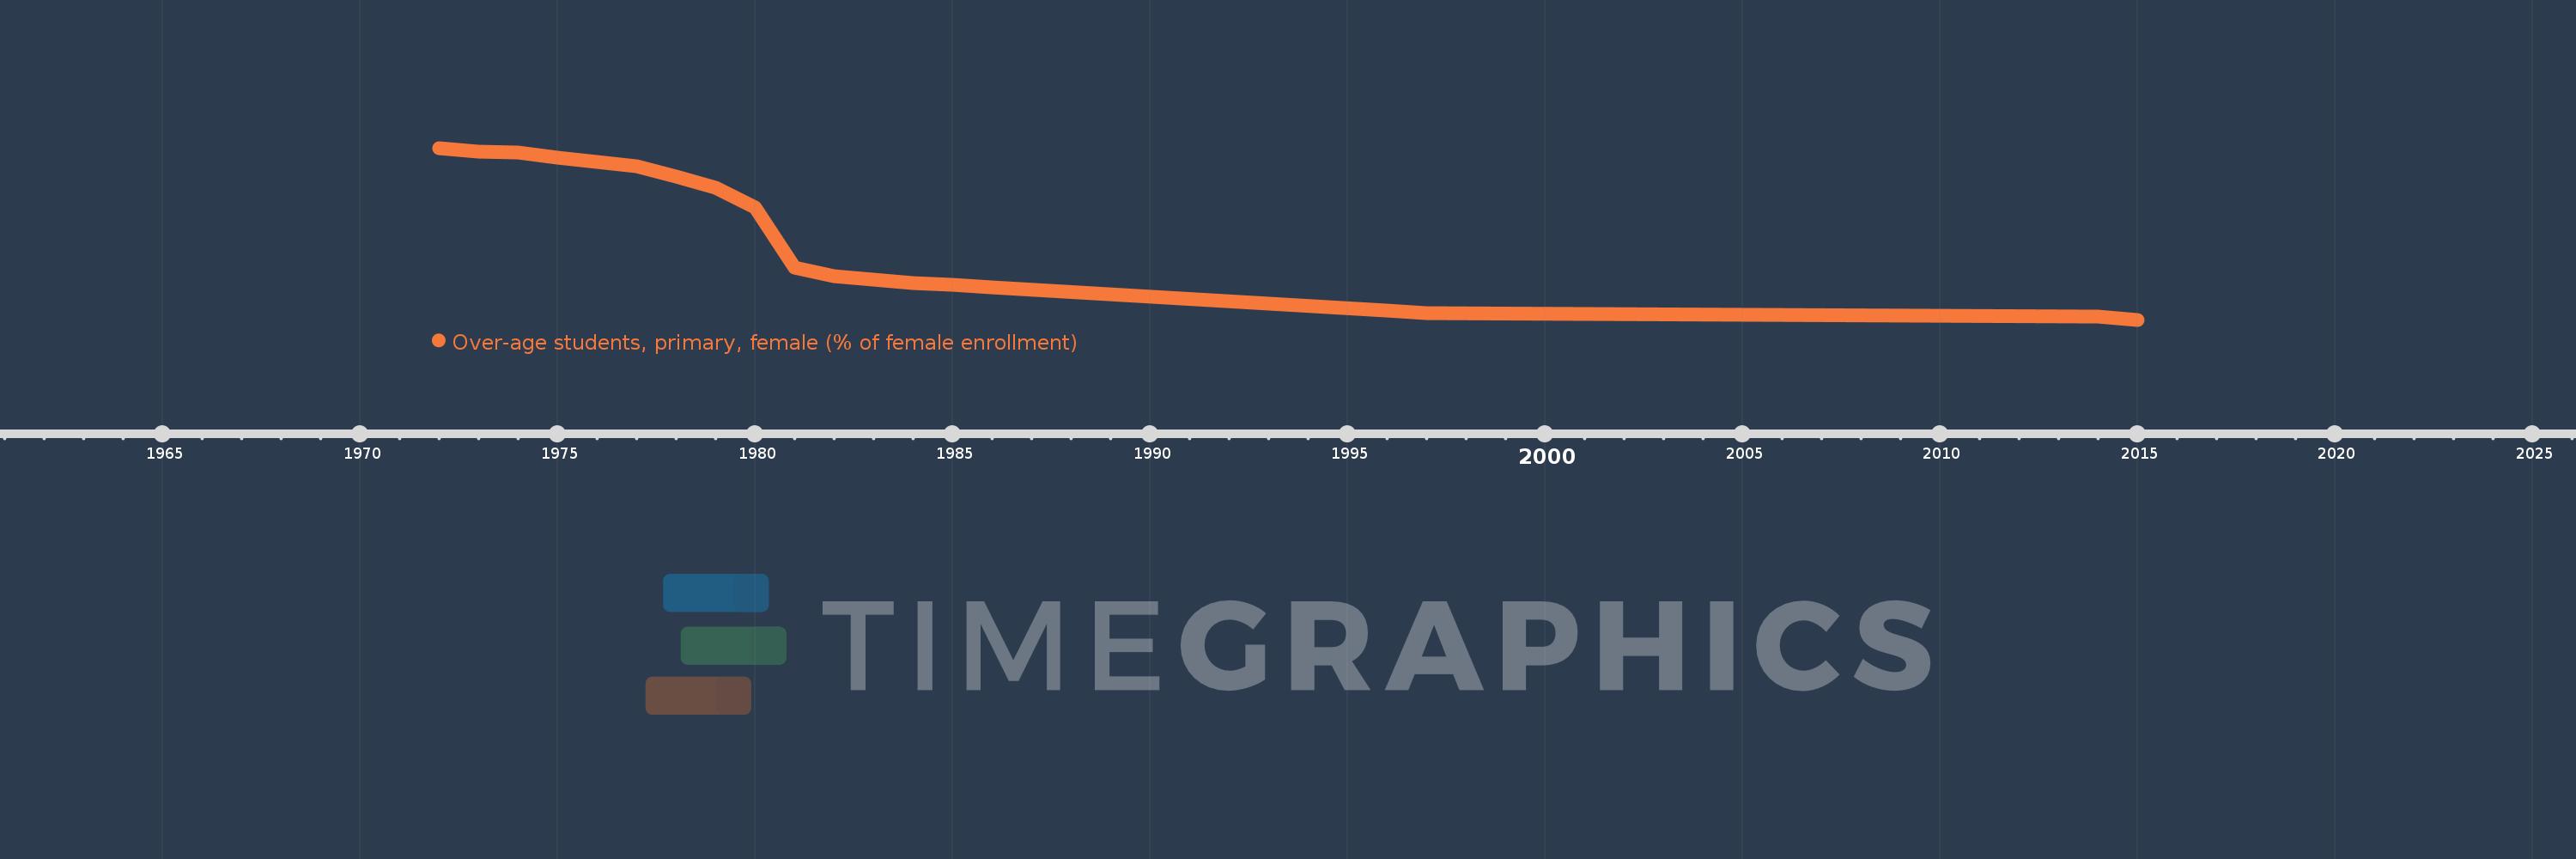
Over-age students, primary, female (% of female enrollment)
2015,2014,1997,1996,1986,1985,1984,1983,1982,1981,1980,1979,1978,1977,1976,1975,1974,1973,1972