33
/
AIzaSyB4mHJ5NPEv-XzF7P6NDYXjlkCWaeKw5bc
November 30, 2025
134460
France
FRA
true
2
1
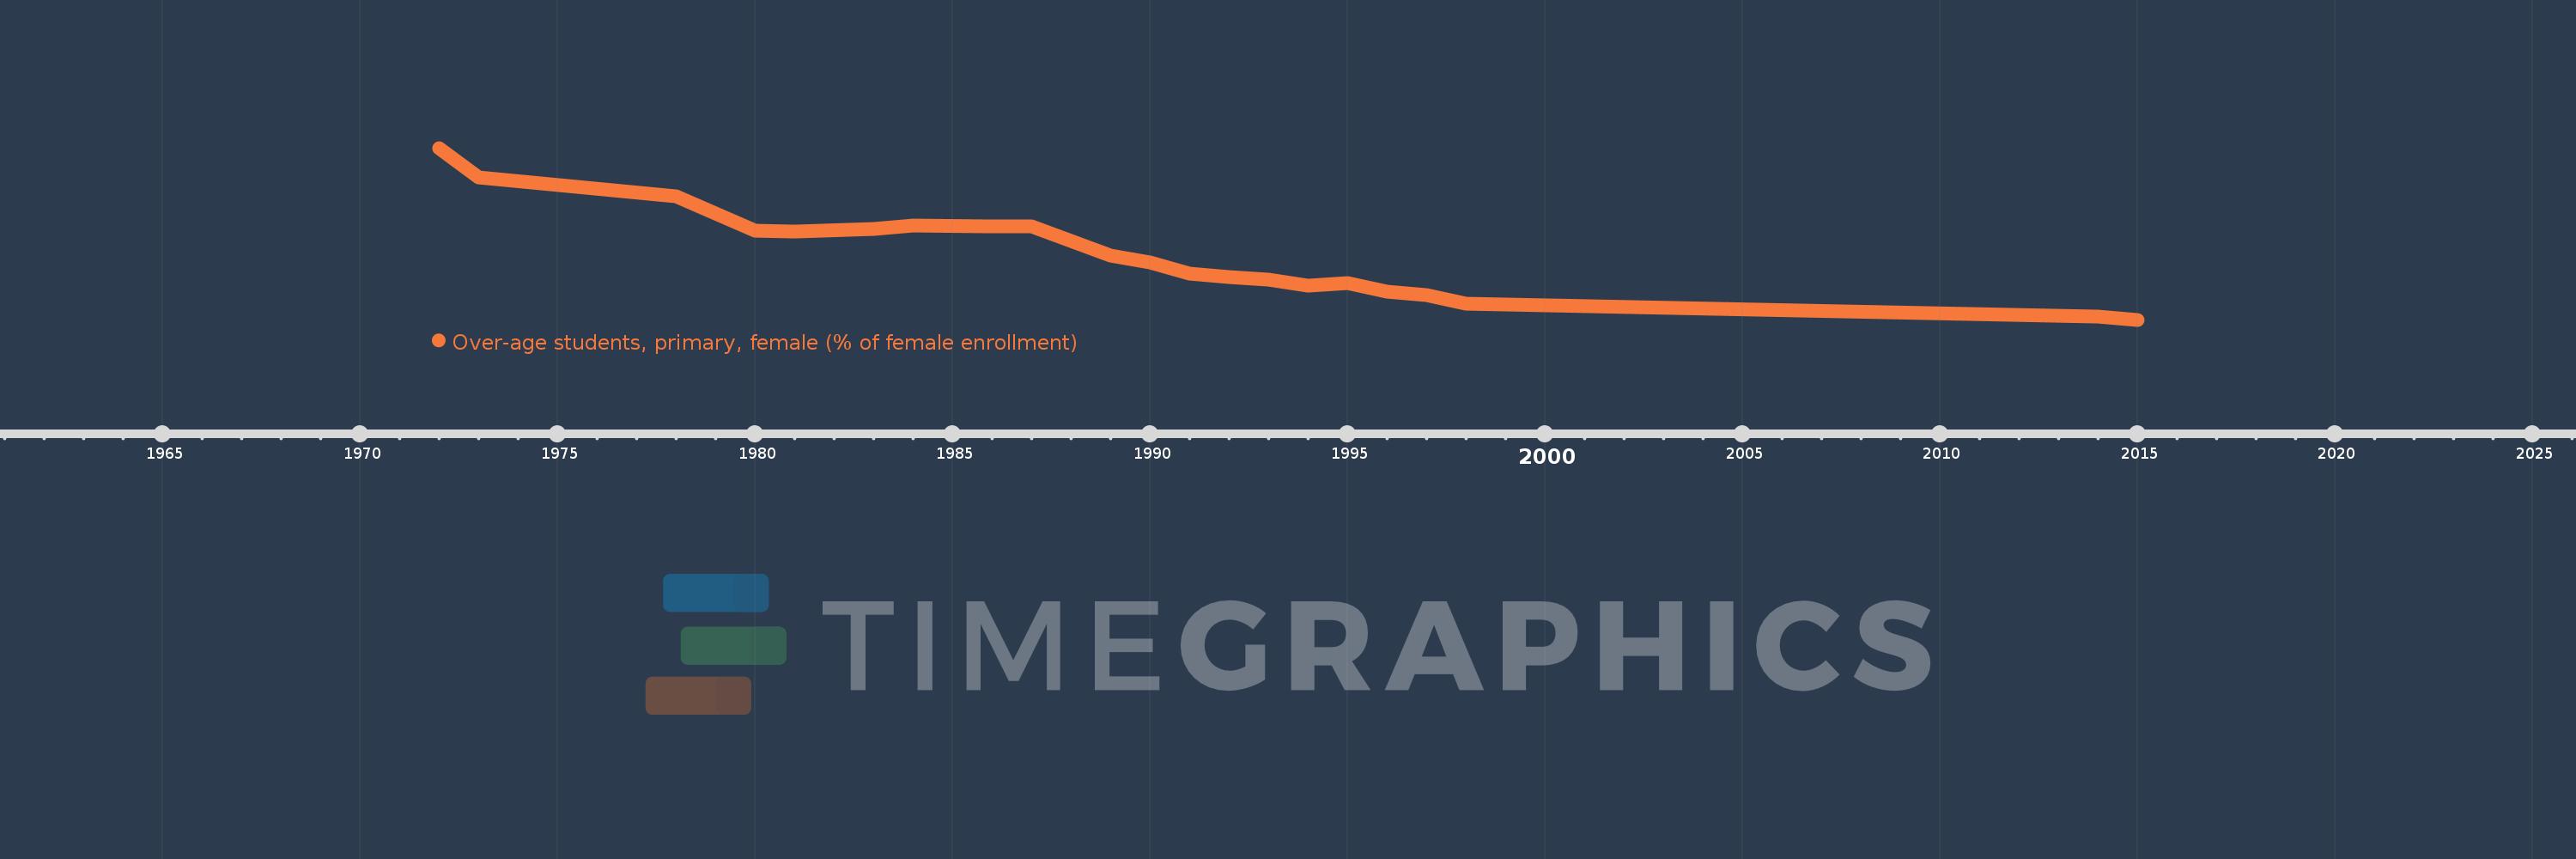
Over-age students, primary, female (% of female enrollment)
2015,2014,1998,1997,1996,1995,1994,1993,1992,1991,1990,1989,1988,1987,1986,1984,1983,1981,1980,1978,1973,1972