33
/
AIzaSyB4mHJ5NPEv-XzF7P6NDYXjlkCWaeKw5bc
November 30, 2025
149910
Honduras
HND
true
2
1
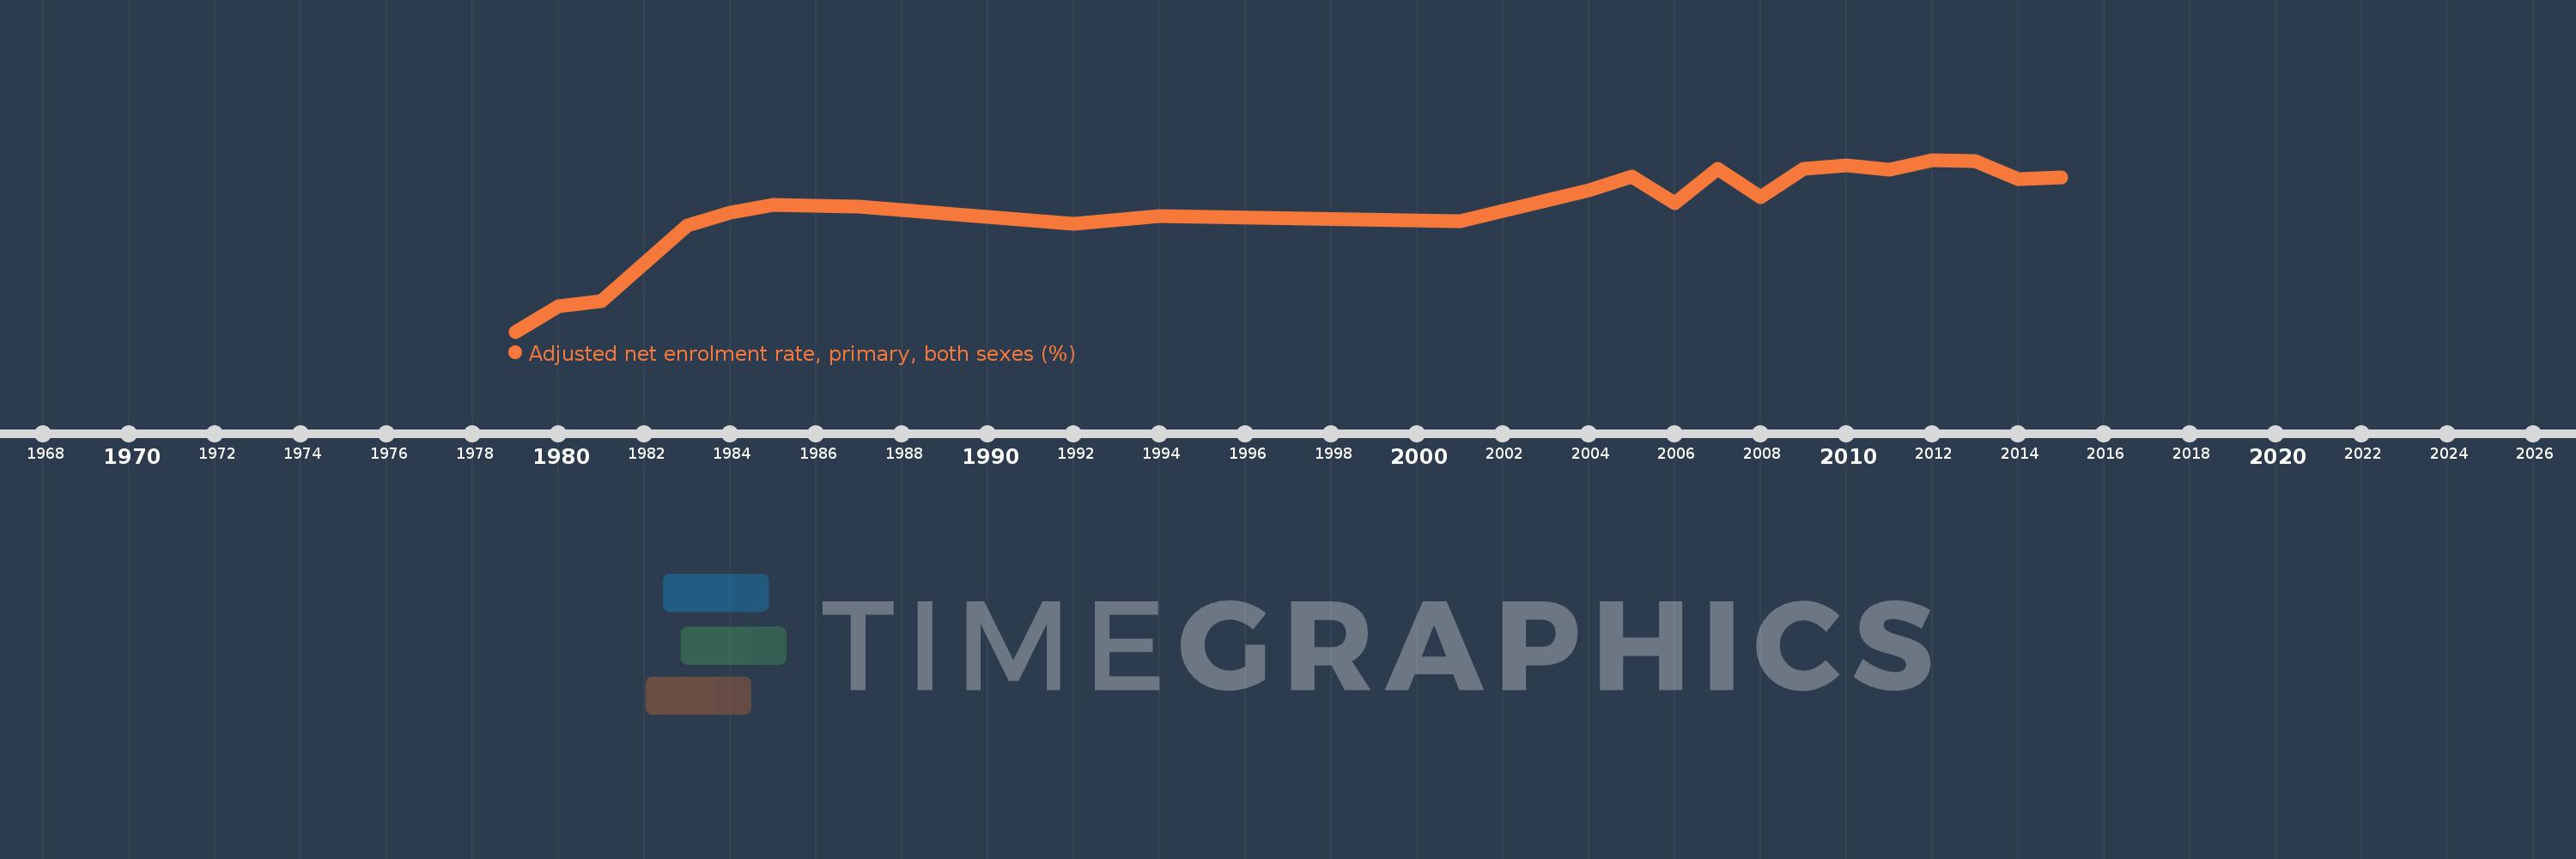
Adjusted net enrolment rate, primary, both sexes (%)
2015,2014,2013,2012,2011,2010,2009,2008,2007,2006,2005,2004,2001,1994,1992,1987,1985,1984,1983,1981,1980,1979