33
/
AIzaSyB4mHJ5NPEv-XzF7P6NDYXjlkCWaeKw5bc
November 30, 2025
124392
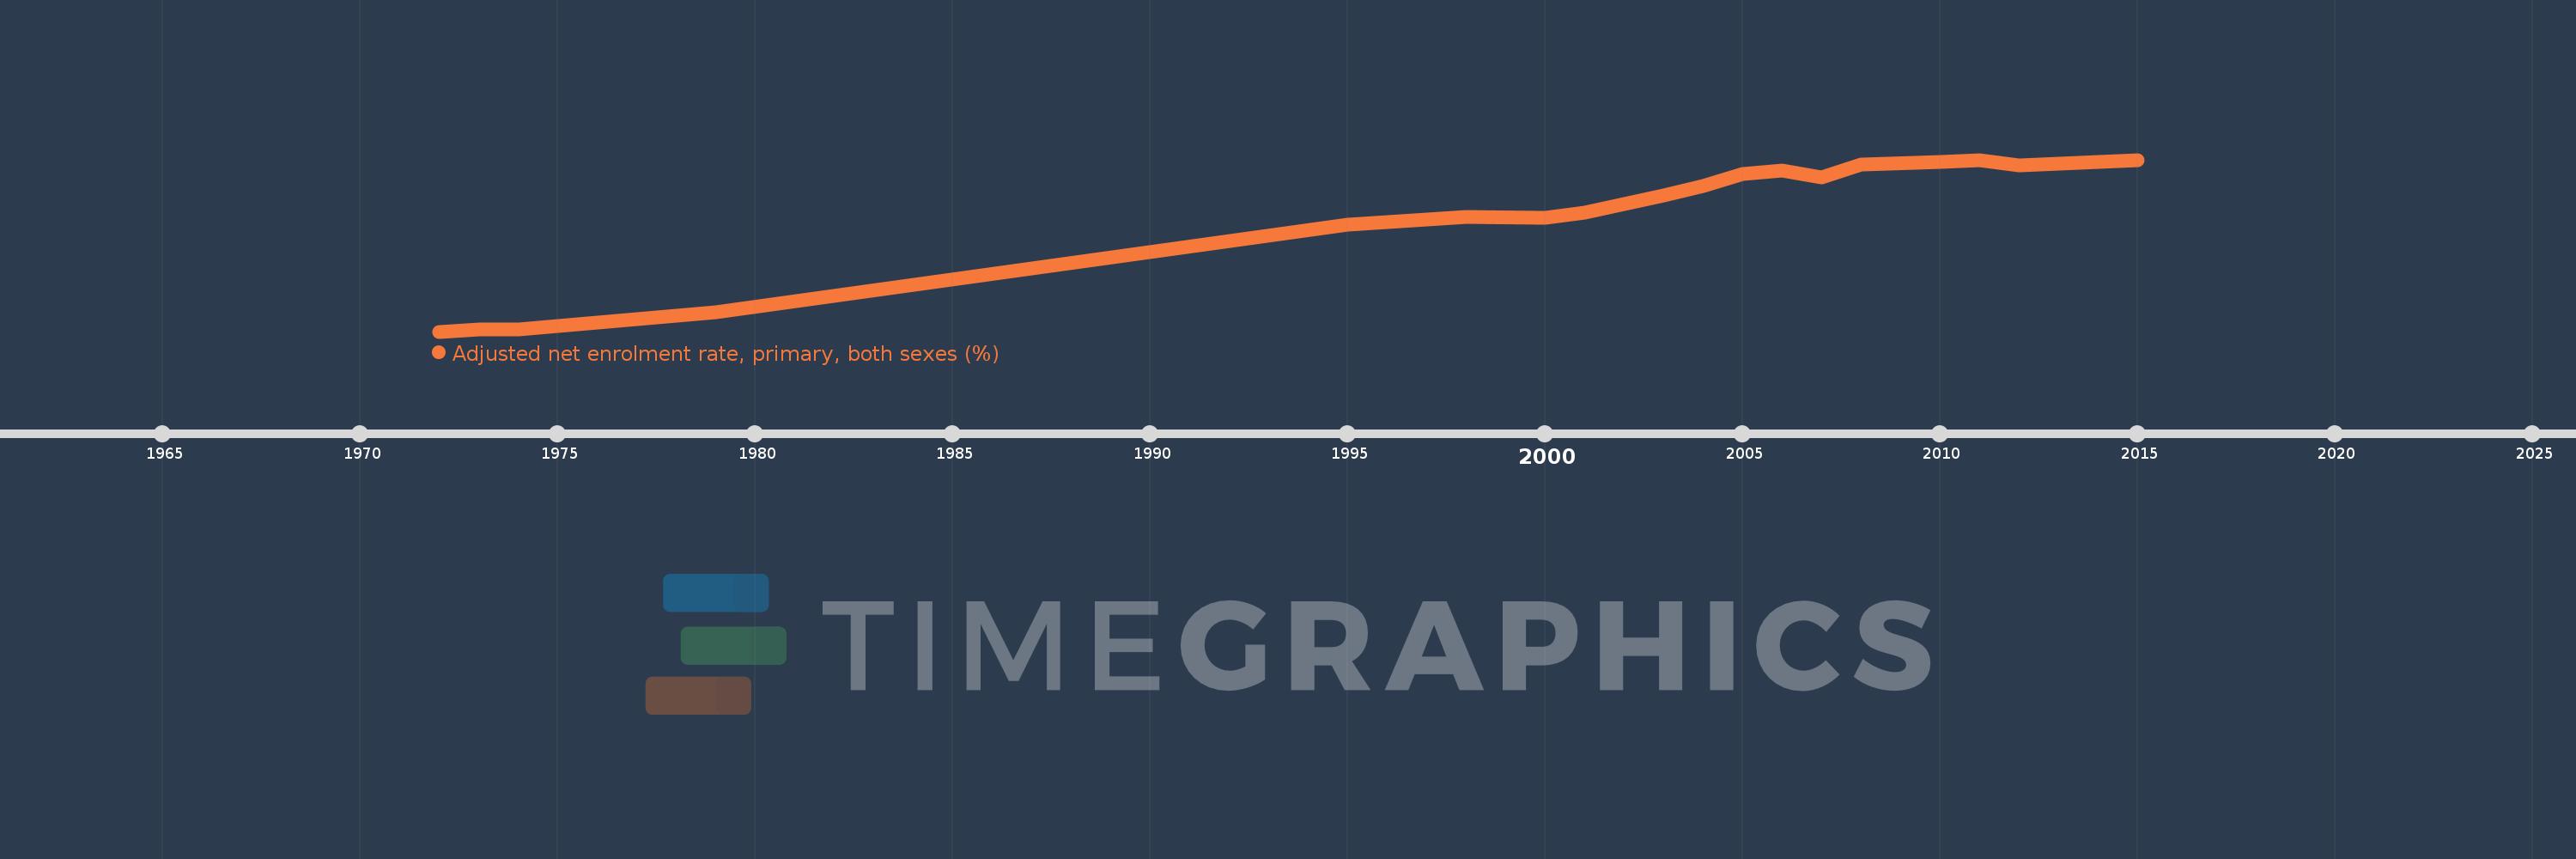
Egypt, Arab Rep.
EGY
true
2
1
Adjusted net enrolment rate, primary, both sexes (%)
2015,2013,2012,2011,2010,2008,2007,2006,2005,2004,2003,2002,2001,2000,1998,1995,1979,1974,1973,1972