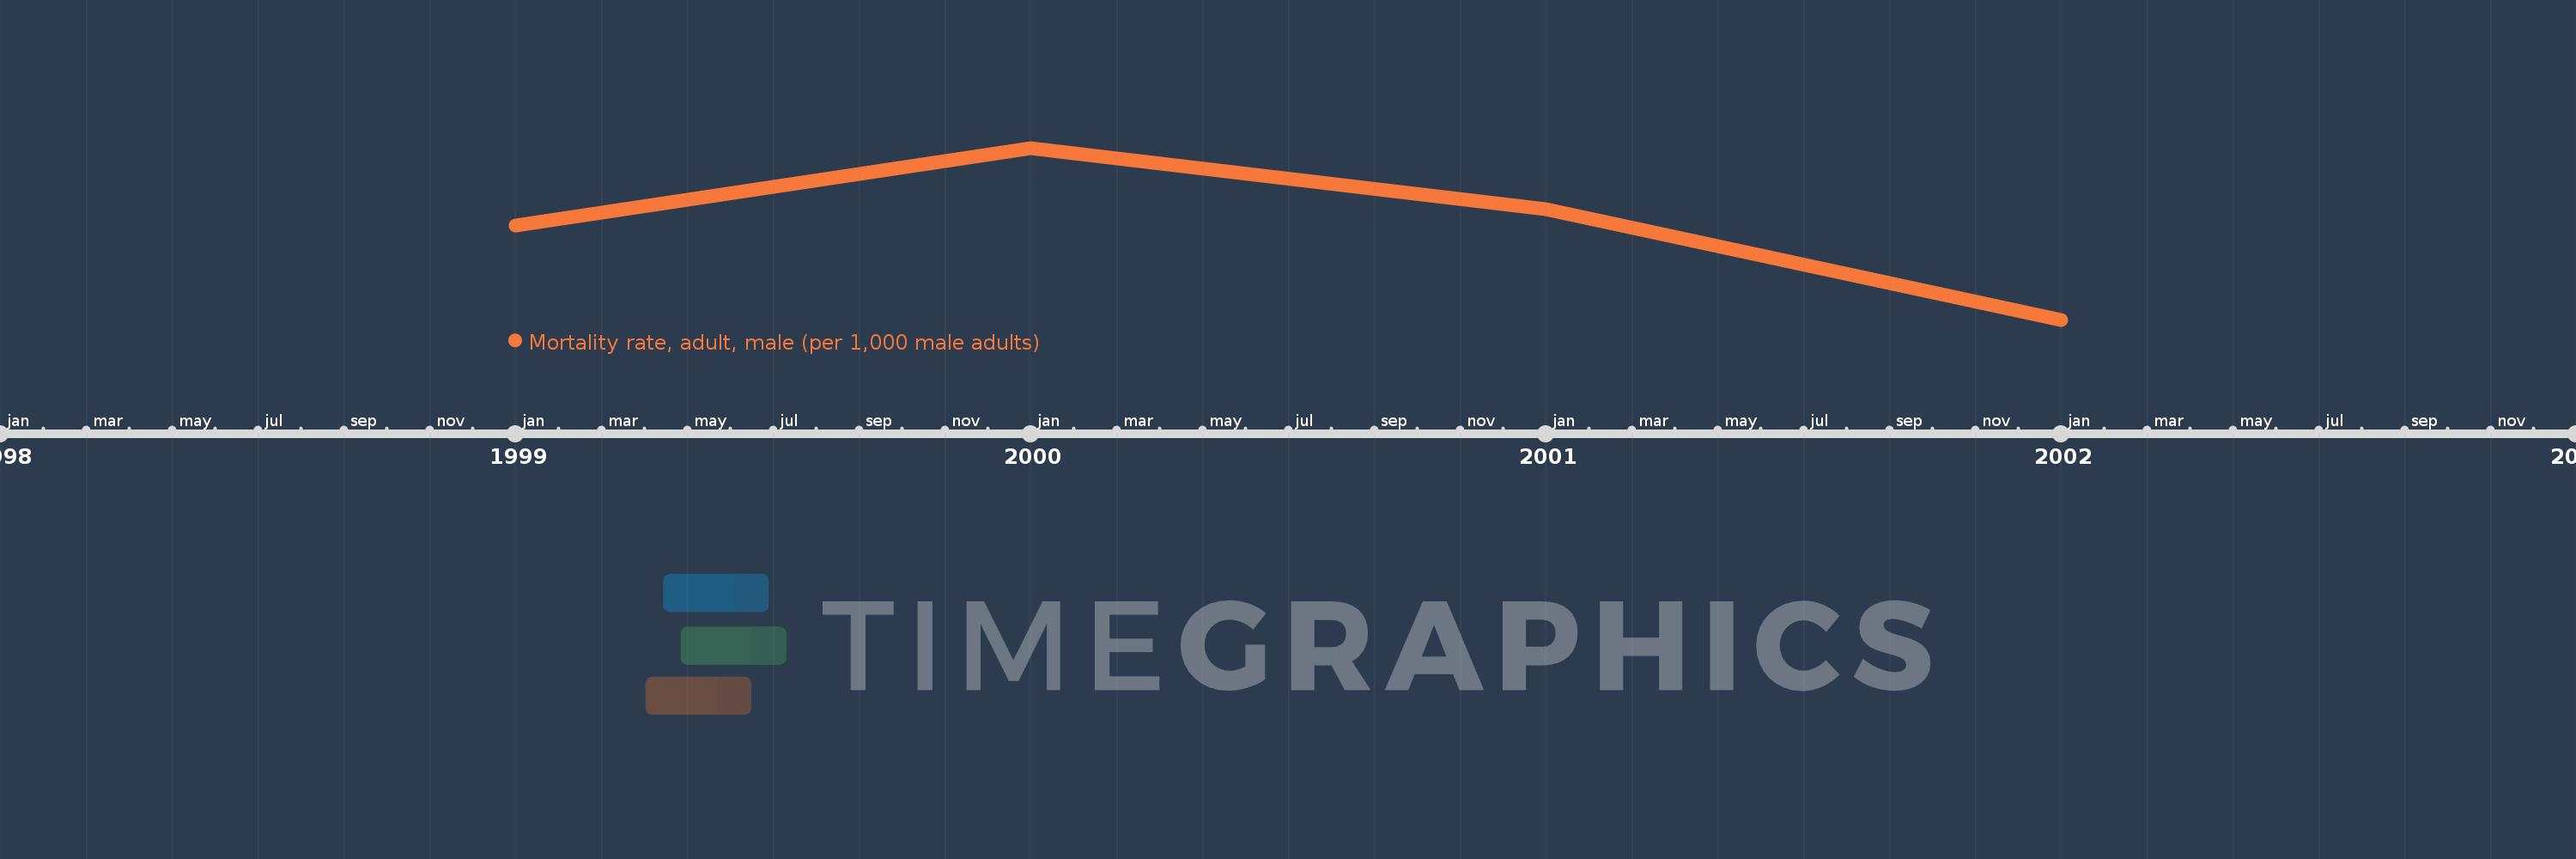
This timeline shows a graph from 1999 to 2002 of Greenland. No data until 1998. Number of actual observations by date: 4.
Source name:
World Development Indicators
Source organization:
(1) United Nations Population Division. World Population Prospects. New York, United Nations, Department of Economic and Social Affairs (advanced Excel tables). Available at http://esa.un.org/wpp/unpp/panel_population.htm, (2) University of California, Berkeley, and Max Planck Institute for Demographic Research. Human Mortality Database. [ www.mortality.org or www.humanmortality.de].
Categories, topics:
Health, Gender
Last updated:
apr 23, 2017
Indicators value changes by year
Meaning:
271.923
Minimum:
261.032
jan 1, 2002
Maximum:
280.944
jan 1, 2000
At the date of observation
Value
Absolute change
Change from the previous value
jan 1, 1999
271.904
+271.904
0.0%
jan 1, 2000
280.944
+9.041
3.32%
jan 1, 2001
273.812
-7.132
-2.54%
jan 1, 2002
261.032
-12.78
-4.67%
Ranking of countries by current statistics by years