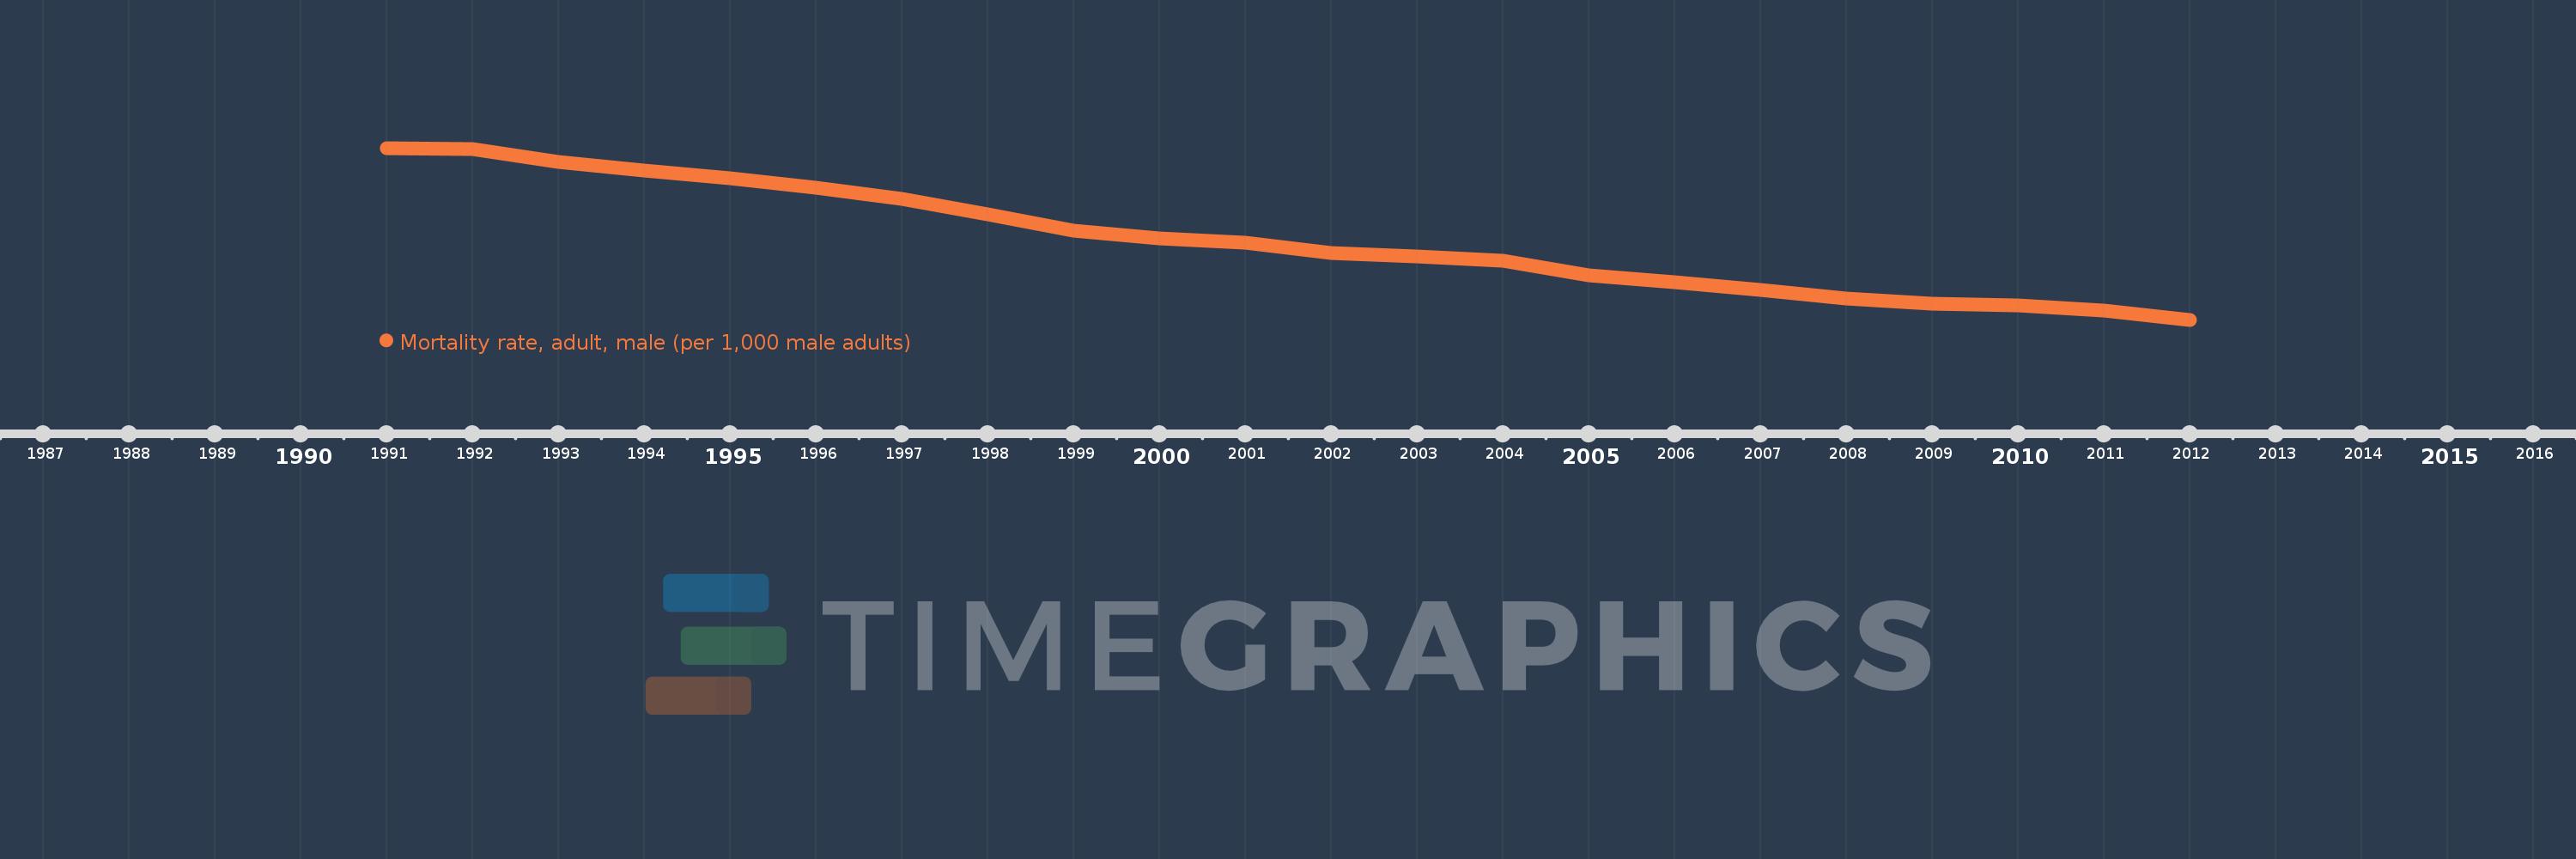
This timeline shows a graph from 1991 to 2012 of Germany. No data until 1990. Number of actual observations by date: 22.
Source name:
World Development Indicators
Source organization:
(1) United Nations Population Division. World Population Prospects. New York, United Nations, Department of Economic and Social Affairs (advanced Excel tables). Available at http://esa.un.org/wpp/unpp/panel_population.htm, (2) University of California, Berkeley, and Max Planck Institute for Demographic Research. Human Mortality Database. [ www.mortality.org or www.humanmortality.de].
Categories, topics:
Health, Gender
Last updated:
apr 23, 2017
Indicators value changes by year
Meaning:
125.025
Minimum:
96.404
jan 1, 2012
Maximum:
157.867
jan 1, 1991
At the date of observation
Value
Absolute change
Change from the previous value
jan 1, 1991
157.867
+157.867
0.0%
jan 1, 1992
157.366
-0.501
-0.32%
jan 1, 1993
152.849
-4.517
-2.87%
jan 1, 1994
149.754
-3.095
-2.02%
jan 1, 1995
147.17
-2.584
-1.73%
jan 1, 1996
143.494
-3.676
-2.5%
jan 1, 1997
139.574
-3.92
-2.73%
jan 1, 1998
134.196
-5.378
-3.85%
jan 1, 1999
128.289
-5.907
-4.4%
jan 1, 2000
125.598
-2.691
-2.1%
jan 1, 2001
124.083
-1.515
-1.21%
jan 1, 2002
120.396
-3.687
-2.97%
jan 1, 2003
119.159
-1.237
-1.03%
jan 1, 2004
117.623
-1.536
-1.29%
jan 1, 2005
112.196
-5.427
-4.61%
jan 1, 2006
109.984
-2.212
-1.97%
jan 1, 2007
106.923
-3.061
-2.78%
jan 1, 2008
104.142
-2.781
-2.6%
jan 1, 2009
102.288
-1.854
-1.78%
jan 1, 2010
101.461
-0.827
-0.81%
jan 1, 2011
99.738
-1.723
-1.7%
jan 1, 2012
96.404
-3.334
-3.34%
Ranking of countries by current statistics by years