Download This statistics in other country:
Timeline:
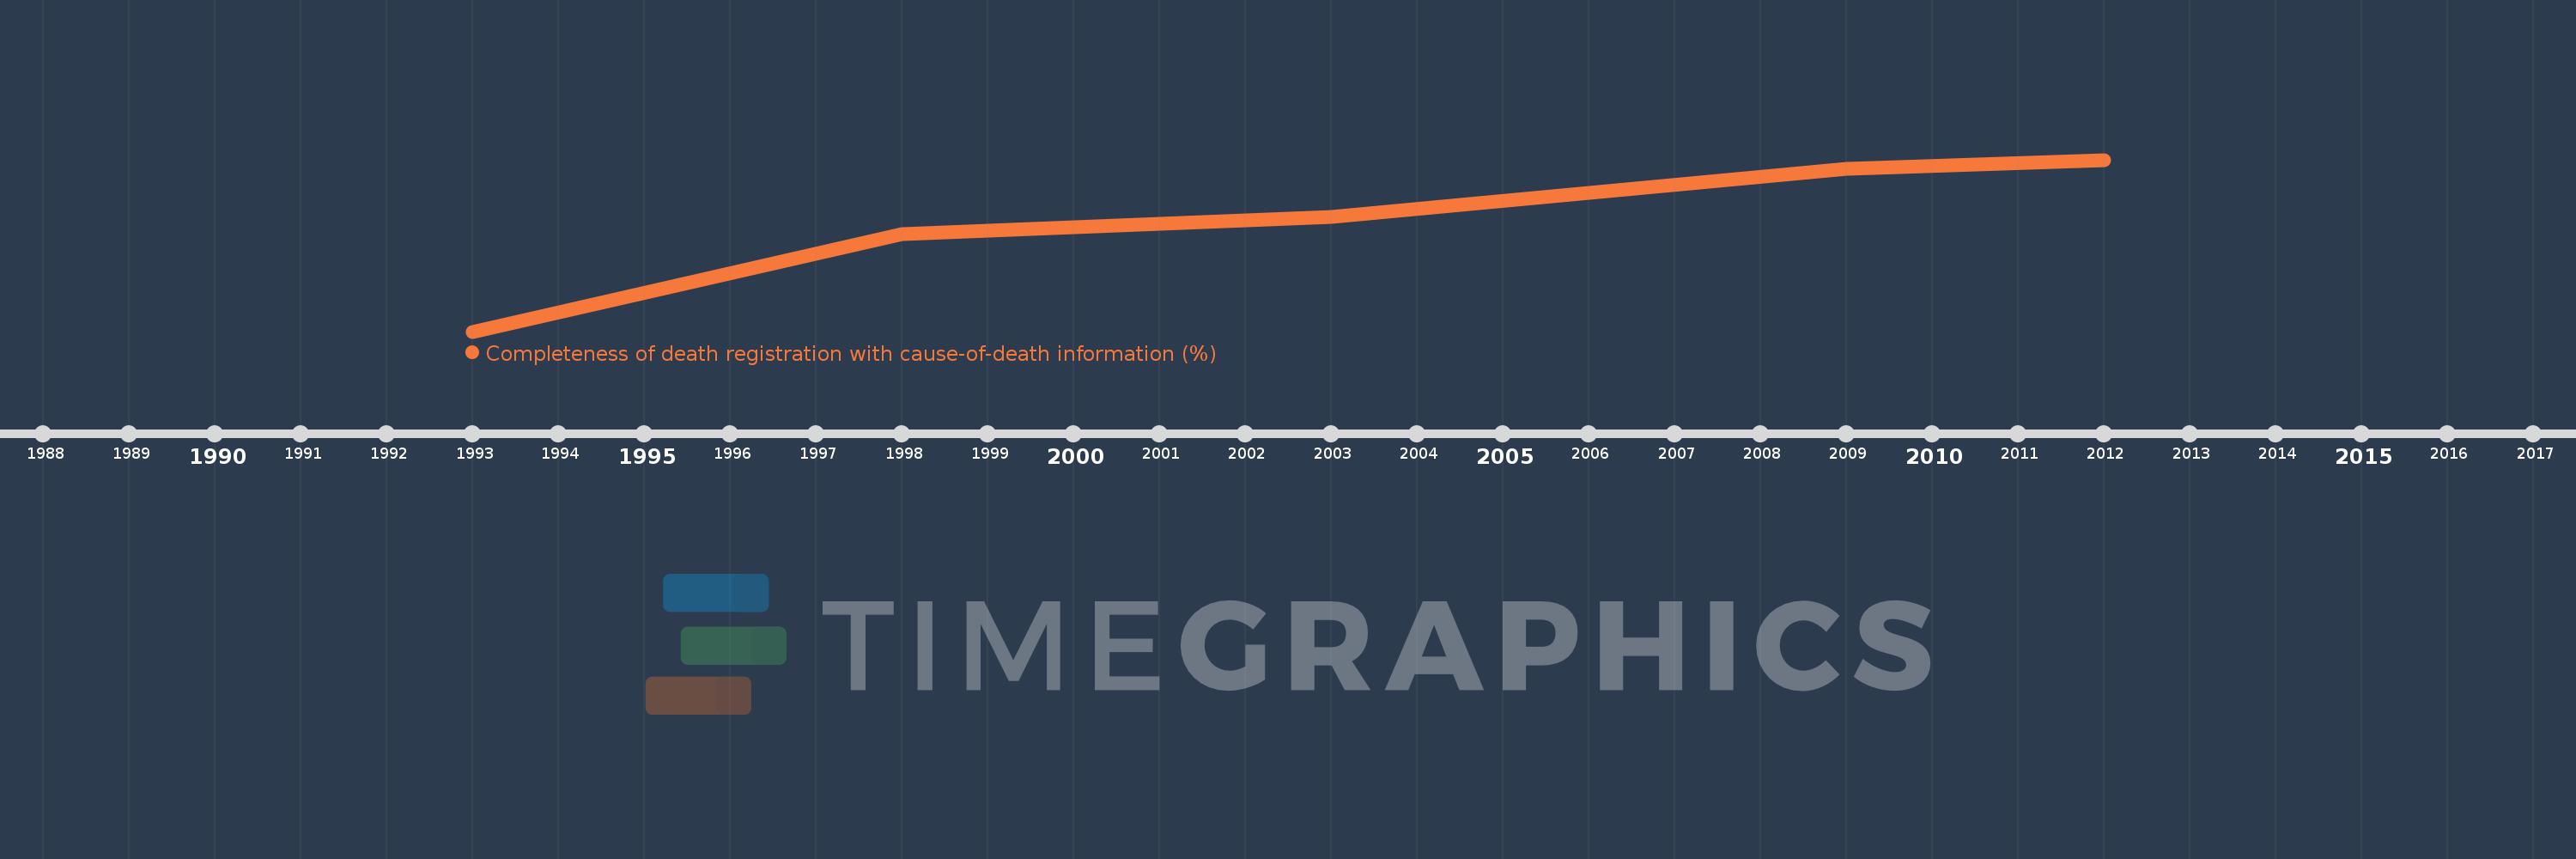
This timeline shows a graph from 1993 to 2012 of El Salvador. No data until 1992. Number of actual observations by date: 5.
Source name:
World Development Indicators
Source organization:
World Health Organization, Global Health Observatory Data Repository/World Health Statistics (http://apps.who.int/gho/data/node.main.1?lang=en).
Categories, topics:
Health
Last updated:
apr 23, 2017
Indicators value changes by year
At the date of observation
Value
Absolute change
Change from the previous value
jan 1, 1993
60.8
+60.8
0.0%
jan 1, 1998
70.6
+9.8
16.12%
jan 1, 2003
72.3
+1.7
2.41%
jan 1, 2009
77.1
+4.8
6.64%
jan 1, 2012
78.0
+0.9
1.17%
Ranking of countries by current statistics by years