33
/
AIzaSyB4mHJ5NPEv-XzF7P6NDYXjlkCWaeKw5bc
November 30, 2025
121904
Dominican Republic
DOM
true
2
1
Completeness of death registration with cause-of-death information (%)
2012,2011,2006,2003,1998,1993
Create a timeline
Public Timelines
For education
For educational institutions
For teachers
For students
Cabinet
For educational institutions
For teachers
For students
Open cabinet
FAQ
Close
Create a timeline
Public timelines
FAQ
About & Feedback
Terms
Privacy
FAQ
Support 24/7
Cabinet
Get premium
Donate
Download
Global statistics library
→
Dominican Republic
→
Completeness of death registration with cause-of-death information (%)
This statistics in other country:
Albania
Andorra
Antigua and Barbuda
Argentina
Armenia
Australia
Austria
Azerbaijan
Bahamas, The
Bahrain
Barbados
Belarus
Belgium
Belize
Bosnia and Herzegovina
Brazil
Brunei Darussalam
Bulgaria
Canada
Caribbean small states
Central Europe and the Baltics
Chile
China
Colombia
Costa Rica
Croatia
Cuba
Cyprus
Czech Republic
Denmark
Dominica
Dominican Republic
East Asia & Pacific
East Asia & Pacific (excluding high income)
East Asia & Pacific (IDA & IBRD countries)
Ecuador
Egypt, Arab Rep.
El Salvador
Estonia
Euro area
Europe & Central Asia
Europe & Central Asia (excluding high income)
Europe & Central Asia (IDA & IBRD countries)
European Union
Fiji
Finland
France
Georgia
Germany
Greece
Grenada
Guatemala
Guyana
Haiti
High income
Honduras
Hungary
IBRD only
Iceland
IDA & IBRD total
India
Iran, Islamic Rep.
Iraq
Ireland
Israel
Italy
Jamaica
Japan
Jordan
Kazakhstan
Kiribati
Korea, Rep.
Kuwait
Kyrgyz Republic
Late-demographic dividend
Latin America & Caribbean
Latin America & Caribbean (excluding high income)
Latin America & the Caribbean (IDA & IBRD countries)
Latvia
Lithuania
Luxembourg
Macedonia, FYR
Malaysia
Maldives
Malta
Mauritius
Mexico
Middle income
Moldova
Monaco
Mongolia
Montenegro
Morocco
Netherlands
New Zealand
Nicaragua
North America
Norway
OECD members
Oman
Panama
Paraguay
Peru
Philippines
Poland
Portugal
Post-demographic dividend
Qatar
Romania
Russian Federation
San Marino
Saudi Arabia
Serbia
Seychelles
Singapore
Slovak Republic
Slovenia
South Africa
South Asia
South Asia (IDA & IBRD)
Spain
Sri Lanka
St. Kitts and Nevis
St. Lucia
St. Vincent and the Grenadines
Suriname
Sweden
Switzerland
Syrian Arab Republic
Tajikistan
Thailand
Trinidad and Tobago
Tunisia
Turkey
Turkmenistan
Ukraine
United Arab Emirates
United Kingdom
United States
Upper middle income
Uruguay
Uzbekistan
Venezuela, RB
World
Zimbabwe
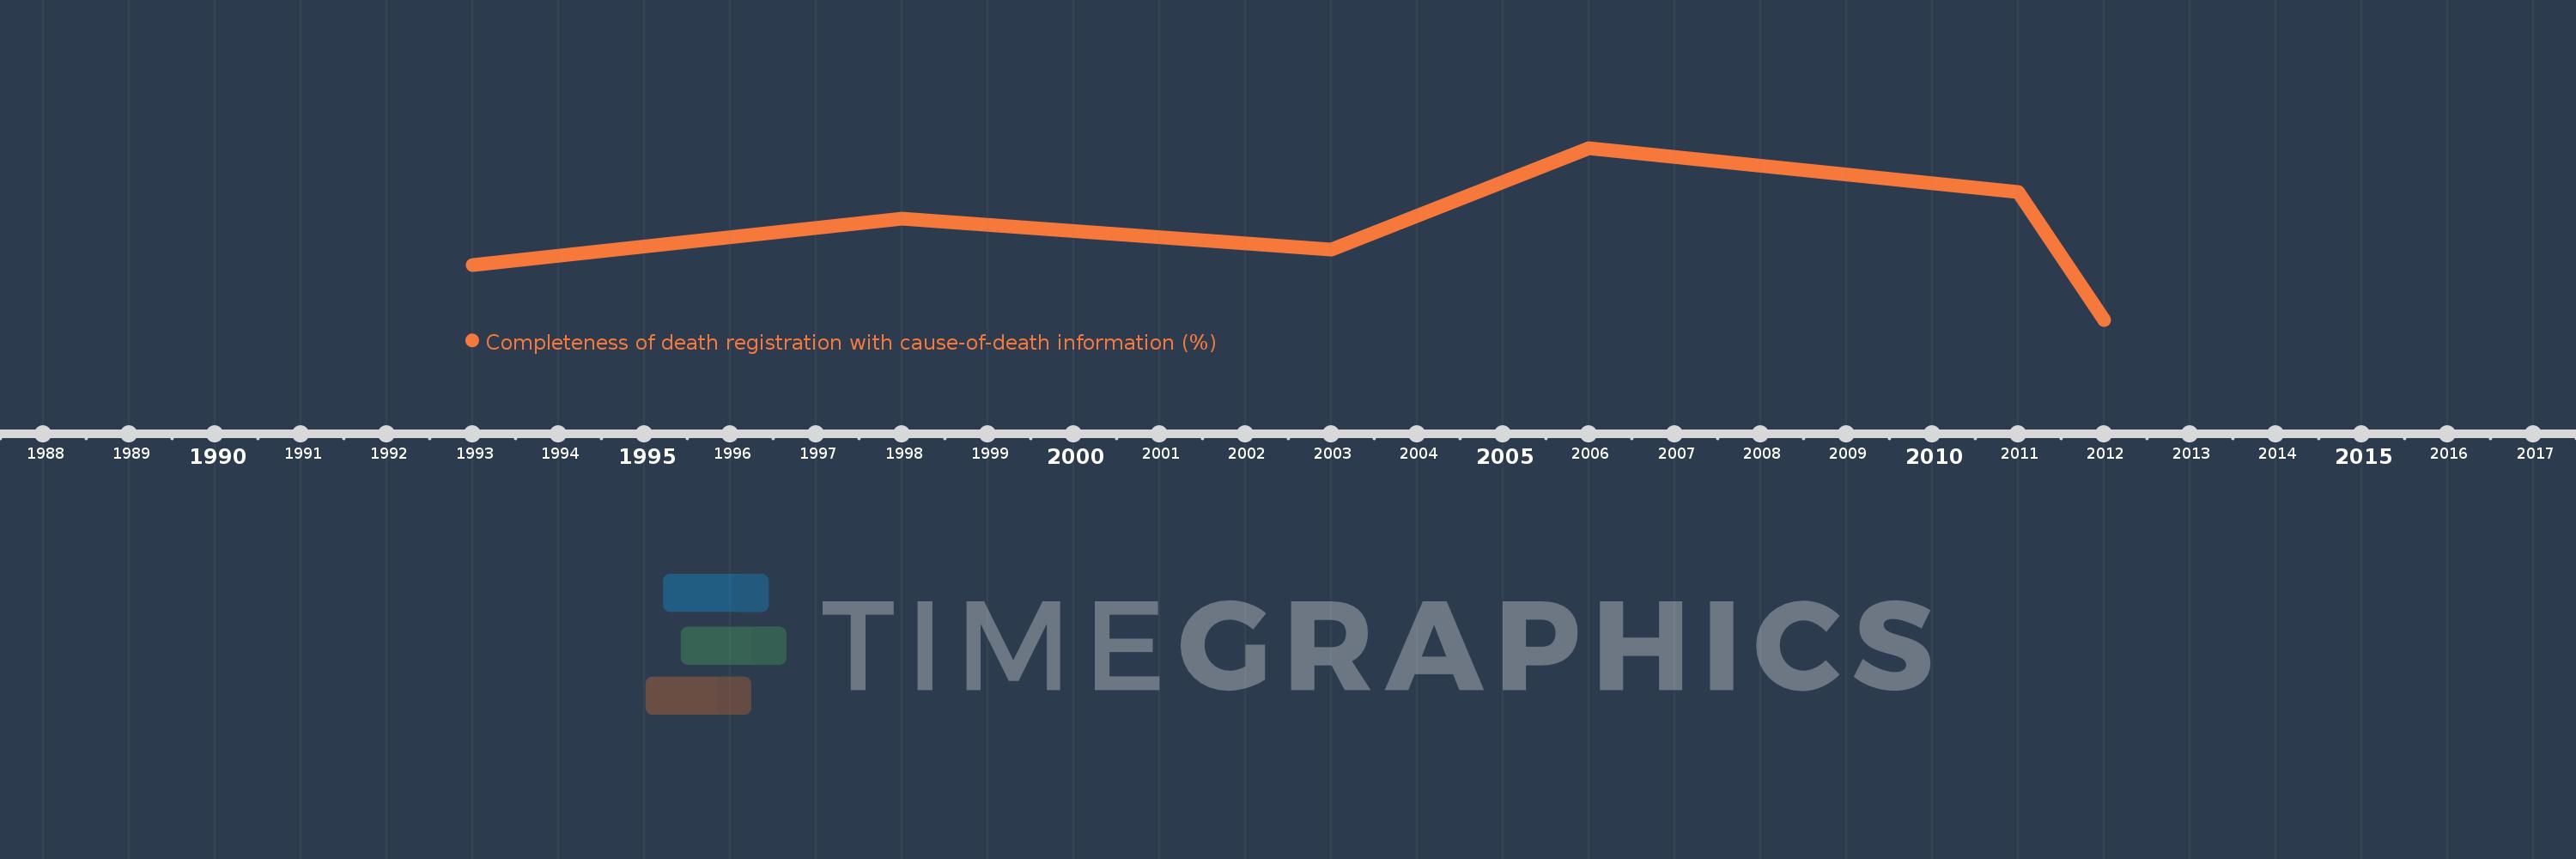
Timeline:
This timeline shows a graph from
1993
to
2012
of Dominican Republic. No data until
1992
. Number of actual observations by date:
6
.
Source name:
World Development Indicators
Source organization:
World Health Organization, Global Health Observatory Data Repository/World Health Statistics (http://apps.who.int/gho/data/node.main.1?lang=en).
Categories, topics:
Health
Last updated:
apr 23, 2017
Indicators value changes by year
Meaning:
55.367
Minimum:
52.0
jan 1, 2012
Maximum:
58.6
jan 1, 2006
At the date of observation
Value
Absolute change
Change from the previous value
jan 1, 1993
54.1
+54.1
0.0%
jan 1, 1998
55.9
+1.8
3.33%
jan 1, 2003
54.7
-1.2
-2.15%
jan 1, 2006
58.6
+3.9
7.13%
jan 1, 2011
56.9
-1.7
-2.9%
jan 1, 2012
52.0
-4.9
-8.61%
Ranking of countries by current statistics by years
About & Feedback
Terms
Privacy
FAQ
Support 24/7
Cabinet
Get premium
Donate
The service accepts bank transfer (ACH, Wire) or cards (Visa, MasterCard, etc). Processed by Stripe.
Secured with SSL