Download This statistics in other country:
Timeline:
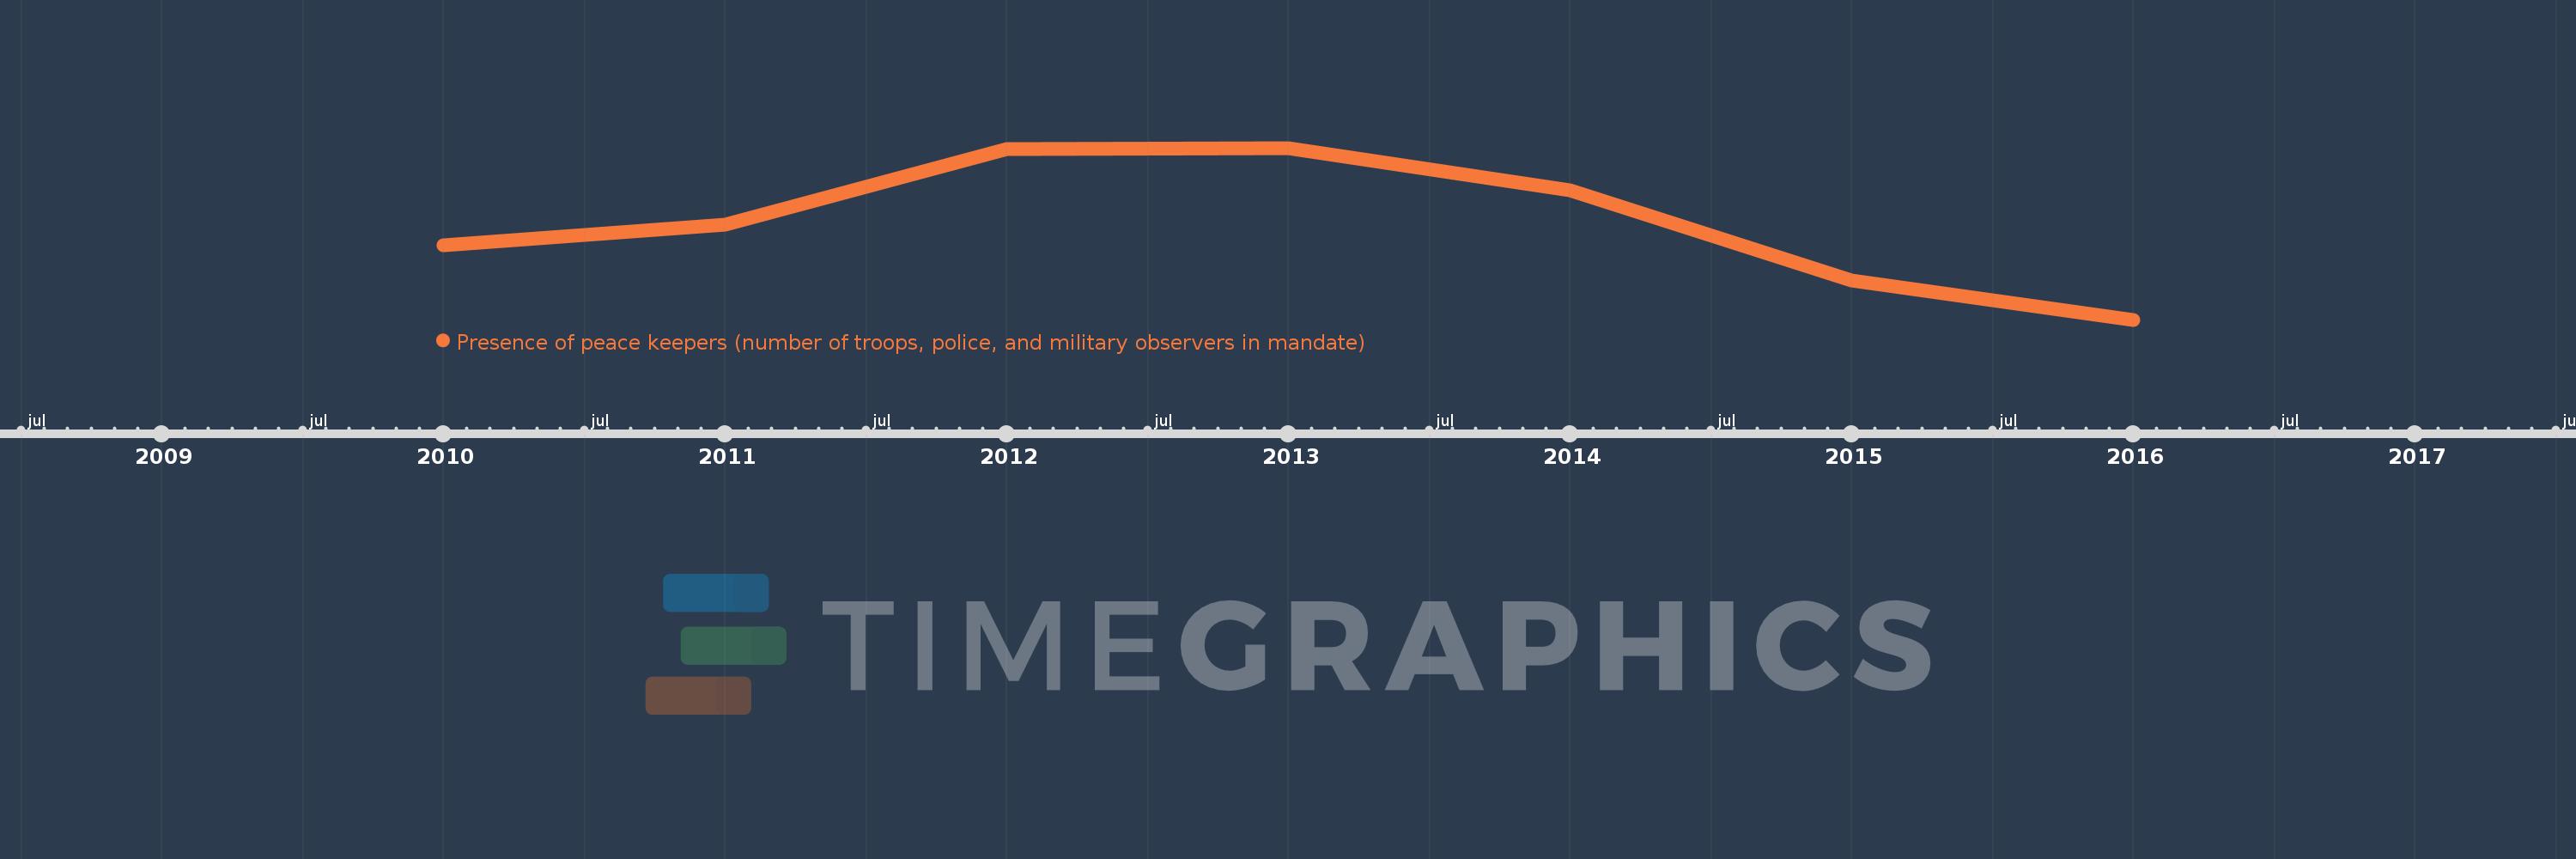
This timeline shows a graph from 2010 to 2016 of Cote d'Ivoire. No data until 2009. Number of actual observations by date: 7.
Source name:
World Development Indicators
Source organization:
UN Department of Peacekeeping Operations, http://www.un.org/en/peacekeeping/.
Categories, topics:
Public Sector
Last updated:
apr 23, 2017
Indicators value changes by year
Minimum:
6.618K
jan 1, 2016
Maximum:
11.033K
jan 1, 2013
At the date of observation
Value
Absolute change
Change from the previous value
jan 1, 2010
8.536K
+8.536K
0.0%
jan 1, 2011
9.071K
+535.0
6.27%
jan 1, 2012
10.999K
+1.928K
21.25%
jan 1, 2013
11.033K
+34.0
0.31%
jan 1, 2014
9.944K
-1.089K
-9.87%
jan 1, 2015
7.633K
-2.311K
-23.24%
jan 1, 2016
6.618K
-1.015K
-13.3%
Ranking of countries by current statistics by years