Download This statistics in other country:
Timeline:
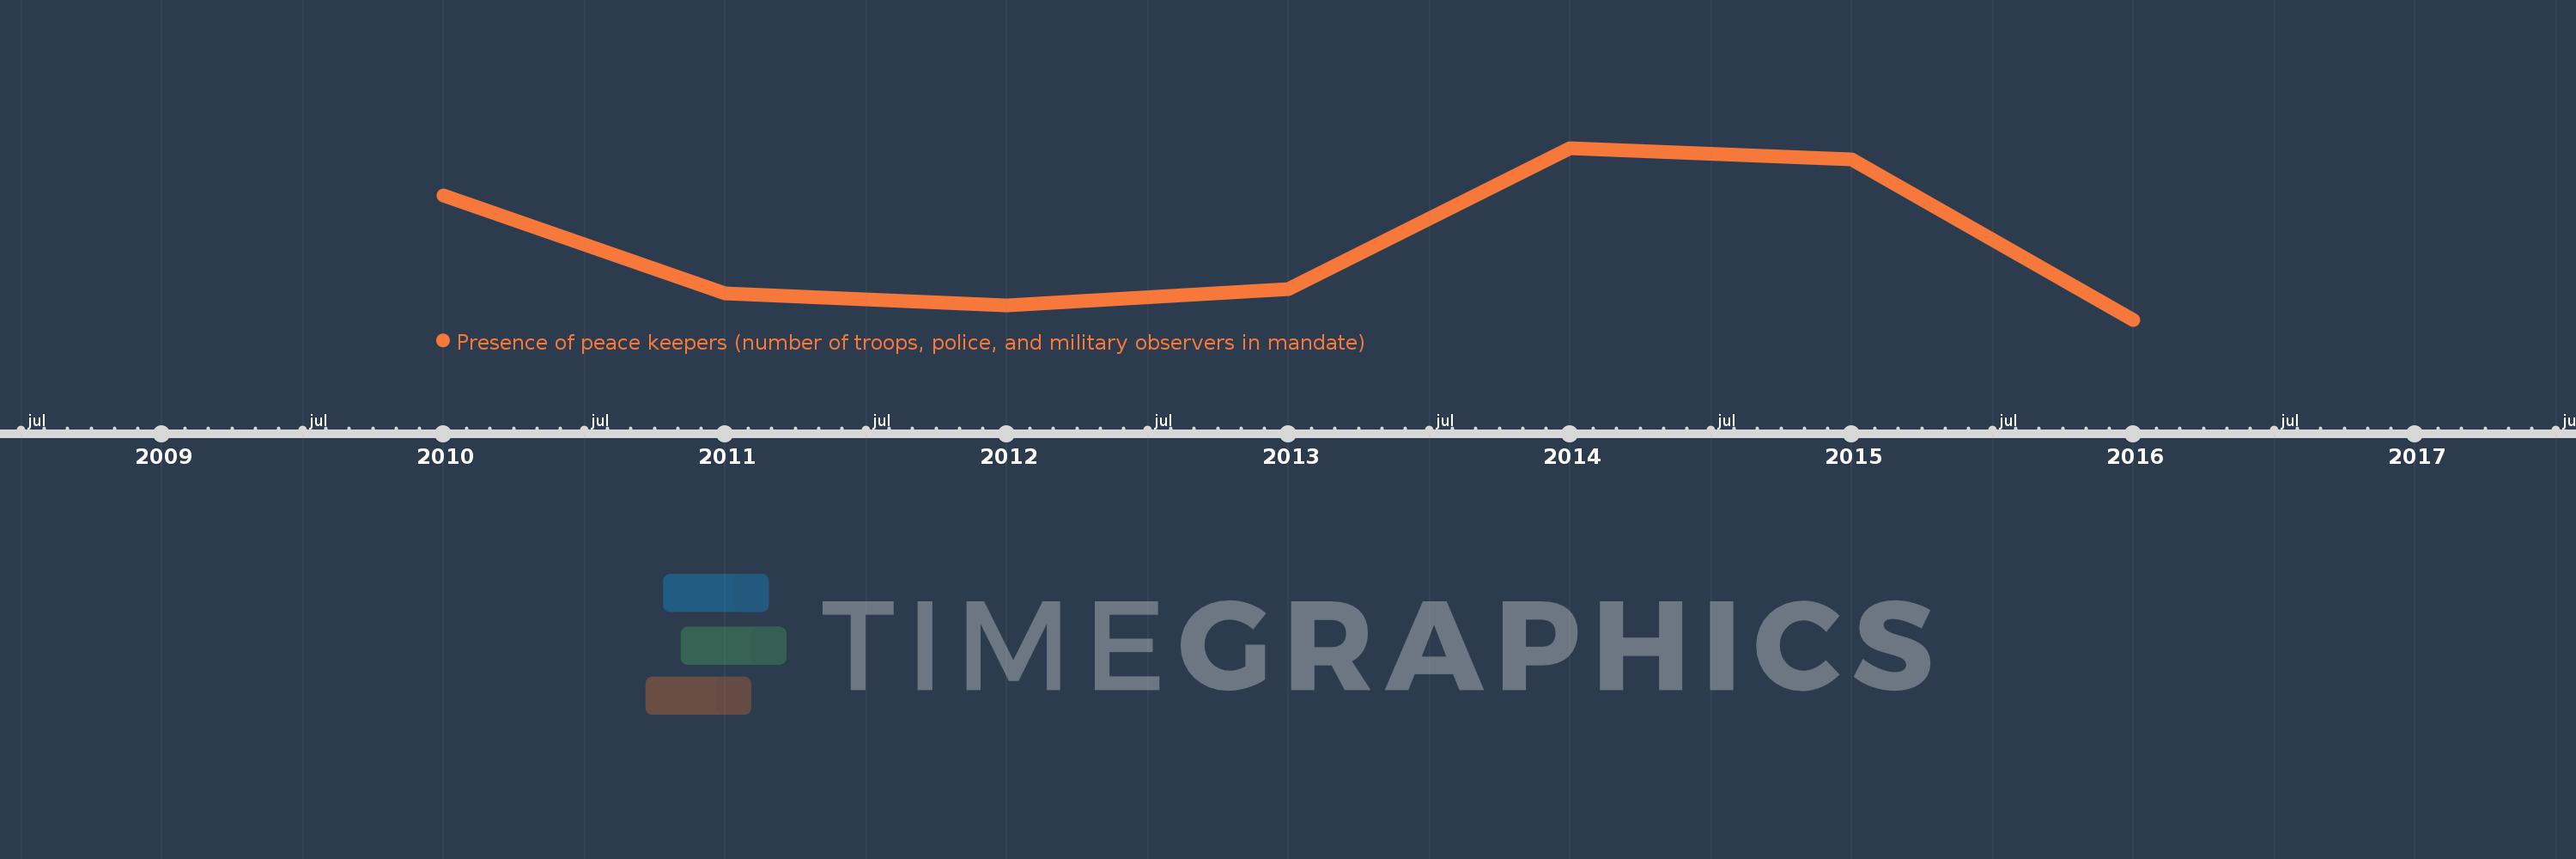
This timeline shows a graph from 2010 to 2016 of Congo, Dem. Rep.. No data until 2009. Number of actual observations by date: 7.
Source name:
World Development Indicators
Source organization:
UN Department of Peacekeeping Operations, http://www.un.org/en/peacekeeping/.
Categories, topics:
Public Sector
Last updated:
apr 23, 2017
Indicators value changes by year
Minimum:
18.727K
jan 1, 2016
Maximum:
21.198K
jan 1, 2014
At the date of observation
Value
Absolute change
Change from the previous value
jan 1, 2010
20.509K
+20.509K
0.0%
jan 1, 2011
19.105K
-1.404K
-6.85%
jan 1, 2012
18.928K
-177.0
-0.93%
jan 1, 2013
19.166K
+238.0
1.26%
jan 1, 2014
21.198K
+2.032K
10.6%
jan 1, 2015
21.036K
-162.0
-0.76%
jan 1, 2016
18.727K
-2.309K
-10.98%
Ranking of countries by current statistics by years