33
/pt/
AIzaSyAYiBZKx7MnpbEhh9jyipgxe19OcubqV5w
August 1, 2025
257246
Switzerland
CHE
true
2
1
Expense (% of GDP)
2014,2013,2012,2011,2010,2009,2008,2007,2006,2005,2004,2003,2002,2001,2000,1999,1998,1997,1996,1995,1994,1993,1992,1985,1984,1983,1982,1981
Download
Biblioteca de estatísticas globais →Switzerland →

Expense (% of GDP)

Estas estatísticas em outros países:

AfghanistanAlbaniaAlgeriaAngolaAntigua and BarbudaArmeniaAustraliaAustriaAzerbaijanBahamas, TheBahrainBangladeshBarbadosBelarusBelgiumBelizeBeninBhutanBoliviaBosnia and HerzegovinaBotswanaBrazilBulgariaBurkina FasoBurundiCabo VerdeCambodiaCanadaCaribbean small statesCentral African RepublicCentral Europe and the BalticsChileColombiaCongo, Dem. Rep.Congo, Rep.Costa RicaCote d'IvoireCroatiaCyprusCzech RepublicDenmarkDominicaDominican RepublicEarly-demographic dividendEgypt, Arab Rep.El SalvadorEquatorial GuineaEstoniaEthiopiaEuro areaEurope & Central AsiaEurope & Central Asia (excluding high income)Europe & Central Asia (IDA & IBRD countries)European UnionFijiFinlandFranceGambia, TheGeorgiaGermanyGhanaGreeceGrenadaGuatemalaHeavily indebted poor countries (HIPC)High incomeHondurasHong Kong SAR, ChinaHungaryIcelandIDA blendIDA onlyIDA totalIndiaIndonesiaIran, Islamic Rep.IraqIrelandIsraelItalyJamaicaJapanJordanKazakhstanKenyaKiribatiKorea, Rep.KuwaitKyrgyz RepublicLao PDRLatin America & Caribbean Latin America & Caribbean (excluding high income)Latin America & the Caribbean (IDA & IBRD countries)LatviaLeast developed countries: UN classificationLebanonLesothoLiberiaLithuaniaLow incomeLower middle incomeLuxembourgMacao SAR, ChinaMacedonia, FYRMadagascarMalawiMalaysiaMaldivesMaliMaltaMauritiusMexicoMicronesia, Fed. Sts.Middle East & North Africa (excluding high income)Middle East & North Africa (IDA & IBRD countries)MoldovaMongoliaMoroccoMozambiqueMyanmarNamibiaNepalNetherlandsNew ZealandNicaraguaNigeriaNorth AmericaNorwayOECD membersOmanOther small statesPacific island small statesPakistanPanamaPapua New GuineaParaguayPeruPhilippinesPolandPortugalPost-demographic dividendPre-demographic dividendQatarRomaniaRussian FederationRwandaSamoaSan MarinoSao Tome and PrincipeSenegalSerbiaSeychellesSierra LeoneSingaporeSlovak RepublicSloveniaSmall statesSolomon IslandsSouth AfricaSouth AsiaSouth Asia (IDA & IBRD)SpainSri LankaSt. Kitts and NevisSt. LuciaSub-Saharan Africa Sub-Saharan Africa (excluding high income)Sub-Saharan Africa (IDA & IBRD countries)SurinameSwazilandSwedenSwitzerlandSyrian Arab RepublicTajikistanTanzaniaThailandTimor-LesteTogoTrinidad and TobagoTunisiaTurkeyUgandaUkraineUnited Arab EmiratesUnited KingdomUnited StatesUruguayVanuatuVenezuela, RBVietnamWest Bank and GazaWorldYemen, Rep.ZambiaZimbabwe

Linha do tempo:

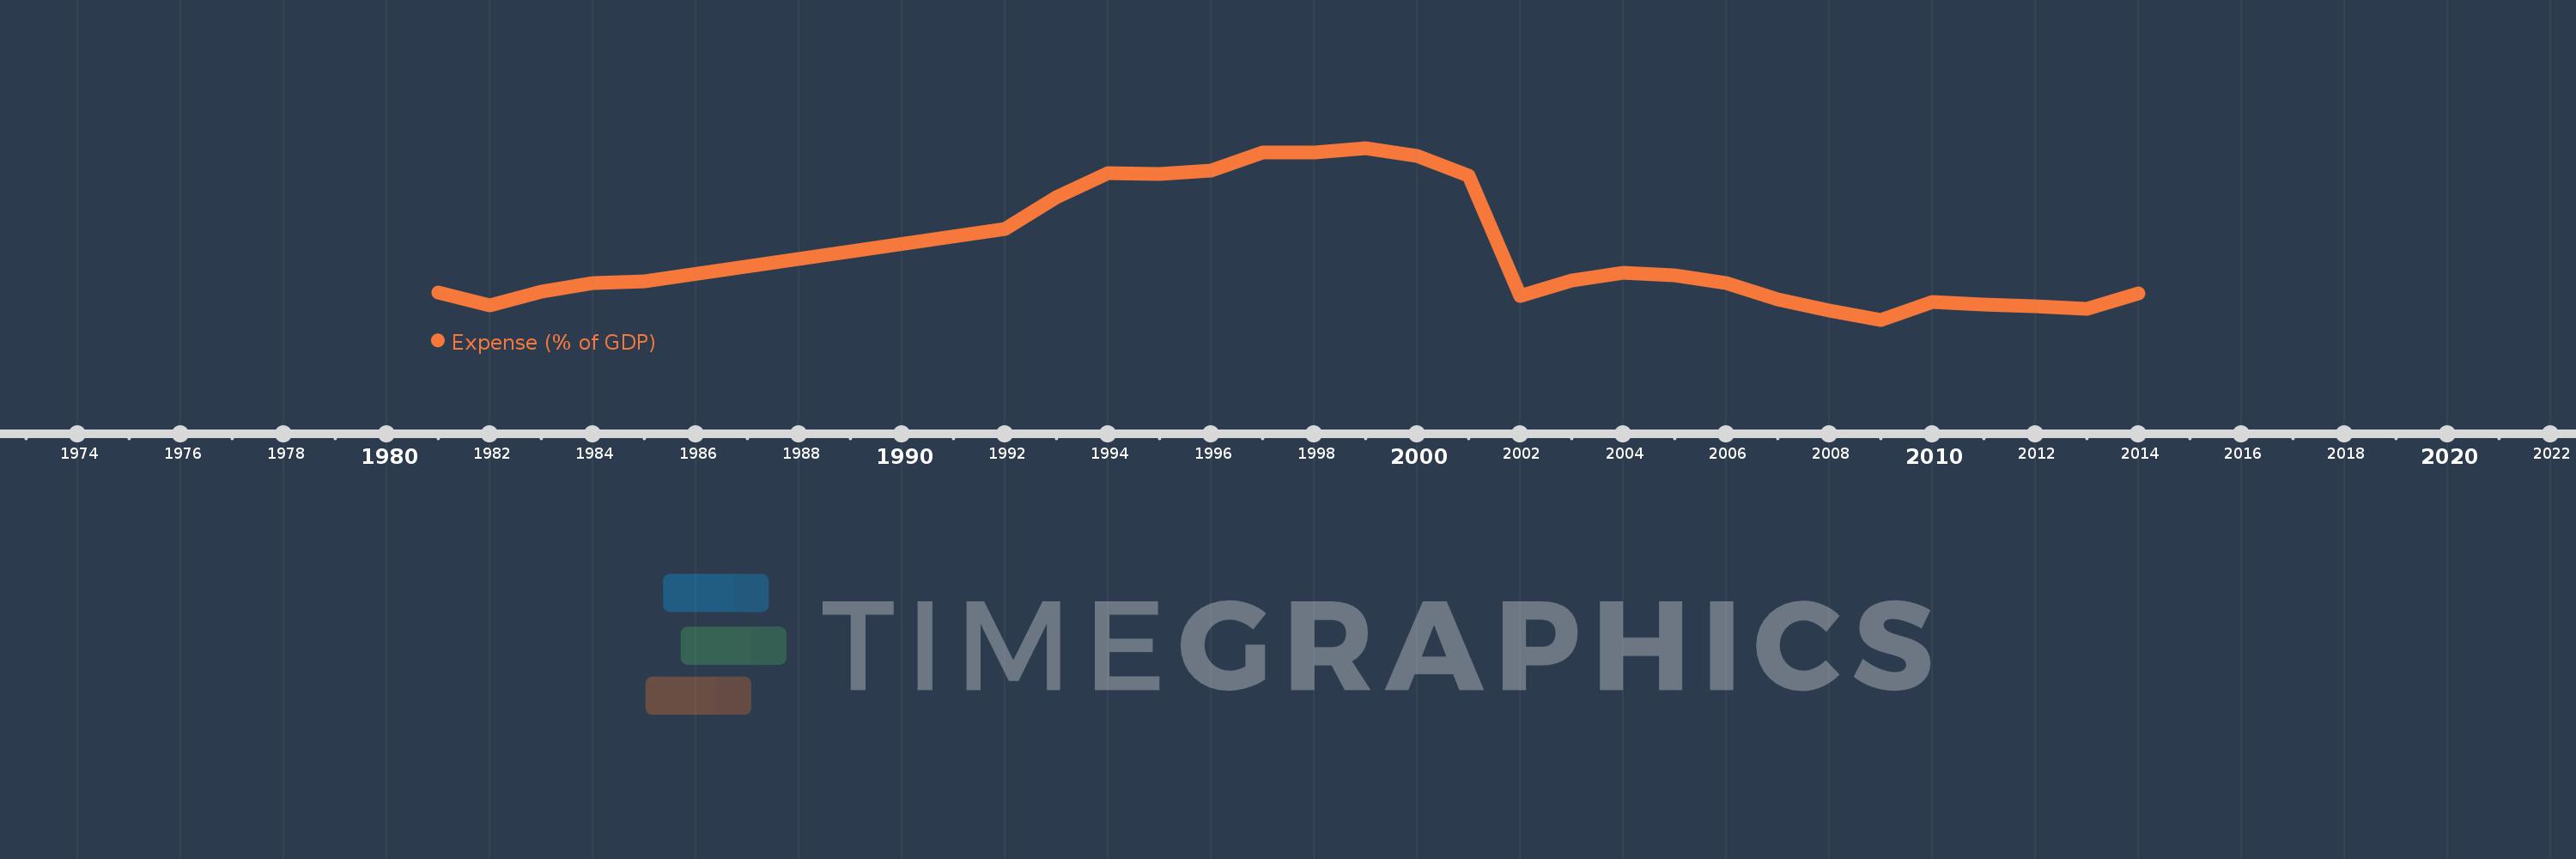
Nesta escala de tempo está apresentado um gráfico de 1981 ano até 2014 ano Switzerland. Dados de 1980 ano ausente. O número de observações reais por data: 28.

Fonte (nome):

Indicadores de desenvolvimento mundial

Fonte (organização):

International Monetary Fund, Government Finance Statistics Yearbook and data files, and World Bank and OECD GDP estimates.

Categorias:

Economy & Growth, Public Sector

Foi atualizado:

23 abr 2017 ano

Indicadores de alterações dos valores ao longo dos anos

Em média:
19.423
Mínimo:
15.758
1 jan 2009 ano
Máximo:
24.954
1 jan 1999 ano
Na data de observação
Valor
Mudança absoluta
A alteração em relação ao valor anterior
1 jan 1981 ano
17.197
+17.197
0.0%
1 jan 1982 ano
16.516
-0.681
-3.96%
1 jan 1983 ano
17.274
+0.758
4.59%
1 jan 1984 ano
17.703
+0.429
2.48%
1 jan 1985 ano
17.792
+0.089
0.5%
1 jan 1992 ano
20.633
+2.842
15.97%
1 jan 1993 ano
22.317
+1.684
8.16%
1 jan 1994 ano
23.604
+1.288
5.77%
1 jan 1995 ano
23.548
-0.057
-0.24%
1 jan 1996 ano
23.755
+0.208
0.88%
1 jan 1997 ano
24.723
+0.968
4.07%
1 jan 1998 ano
24.729
+0.006
0.02%
1 jan 1999 ano
24.954
+0.225
0.91%
1 jan 2000 ano
24.51
-0.443
-1.78%
1 jan 2001 ano
23.472
-1.039
-4.24%
1 jan 2002 ano
17.012
-6.46
-27.52%
1 jan 2003 ano
17.86
+0.848
4.98%
1 jan 2004 ano
18.273
+0.413
2.31%
1 jan 2005 ano
18.122
-0.15
-0.82%
1 jan 2006 ano
17.739
-0.384
-2.12%
1 jan 2007 ano
16.84
-0.899
-5.07%
1 jan 2008 ano
16.228
-0.612
-3.63%
1 jan 2009 ano
15.758
-0.47
-2.9%
1 jan 2010 ano
16.71
+0.952
6.04%
1 jan 2011 ano
16.566
-0.145
-0.87%
1 jan 2012 ano
16.494
-0.071
-0.43%
1 jan 2013 ano
16.342
-0.152
-0.92%
1 jan 2014 ano
17.175
+0.833
5.1%

Classificação de países por estatísticas atuais por anos