33
/pt/
AIzaSyAYiBZKx7MnpbEhh9jyipgxe19OcubqV5w
August 1, 2025
163698
Japan
JPN
true
2
1
Expense (% of GDP)
2014,2013,2012,2011,2010,2009,2008,2007,2006,1991,1990,1989,1988,1987,1986,1985,1984,1983,1982,1981,1980,1979,1978,1977,1976,1975,1974,1973
Download
Biblioteca de estatísticas globais →Japan →

Expense (% of GDP)

Estas estatísticas em outros países:

AfghanistanAlbaniaAlgeriaAngolaAntigua and BarbudaArmeniaAustraliaAustriaAzerbaijanBahamas, TheBahrainBangladeshBarbadosBelarusBelgiumBelizeBeninBhutanBoliviaBosnia and HerzegovinaBotswanaBrazilBulgariaBurkina FasoBurundiCabo VerdeCambodiaCanadaCaribbean small statesCentral African RepublicCentral Europe and the BalticsChileColombiaCongo, Dem. Rep.Congo, Rep.Costa RicaCote d'IvoireCroatiaCyprusCzech RepublicDenmarkDominicaDominican RepublicEarly-demographic dividendEgypt, Arab Rep.El SalvadorEquatorial GuineaEstoniaEthiopiaEuro areaEurope & Central AsiaEurope & Central Asia (excluding high income)Europe & Central Asia (IDA & IBRD countries)European UnionFijiFinlandFranceGambia, TheGeorgiaGermanyGhanaGreeceGrenadaGuatemalaHeavily indebted poor countries (HIPC)High incomeHondurasHong Kong SAR, ChinaHungaryIcelandIDA blendIDA onlyIDA totalIndiaIndonesiaIran, Islamic Rep.IraqIrelandIsraelItalyJamaicaJapanJordanKazakhstanKenyaKiribatiKorea, Rep.KuwaitKyrgyz RepublicLao PDRLatin America & Caribbean Latin America & Caribbean (excluding high income)Latin America & the Caribbean (IDA & IBRD countries)LatviaLeast developed countries: UN classificationLebanonLesothoLiberiaLithuaniaLow incomeLower middle incomeLuxembourgMacao SAR, ChinaMacedonia, FYRMadagascarMalawiMalaysiaMaldivesMaliMaltaMauritiusMexicoMicronesia, Fed. Sts.Middle East & North Africa (excluding high income)Middle East & North Africa (IDA & IBRD countries)MoldovaMongoliaMoroccoMozambiqueMyanmarNamibiaNepalNetherlandsNew ZealandNicaraguaNigeriaNorth AmericaNorwayOECD membersOmanOther small statesPacific island small statesPakistanPanamaPapua New GuineaParaguayPeruPhilippinesPolandPortugalPost-demographic dividendPre-demographic dividendQatarRomaniaRussian FederationRwandaSamoaSan MarinoSao Tome and PrincipeSenegalSerbiaSeychellesSierra LeoneSingaporeSlovak RepublicSloveniaSmall statesSolomon IslandsSouth AfricaSouth AsiaSouth Asia (IDA & IBRD)SpainSri LankaSt. Kitts and NevisSt. LuciaSub-Saharan Africa Sub-Saharan Africa (excluding high income)Sub-Saharan Africa (IDA & IBRD countries)SurinameSwazilandSwedenSwitzerlandSyrian Arab RepublicTajikistanTanzaniaThailandTimor-LesteTogoTrinidad and TobagoTunisiaTurkeyUgandaUkraineUnited Arab EmiratesUnited KingdomUnited StatesUruguayVanuatuVenezuela, RBVietnamWest Bank and GazaWorldYemen, Rep.ZambiaZimbabwe

Linha do tempo:

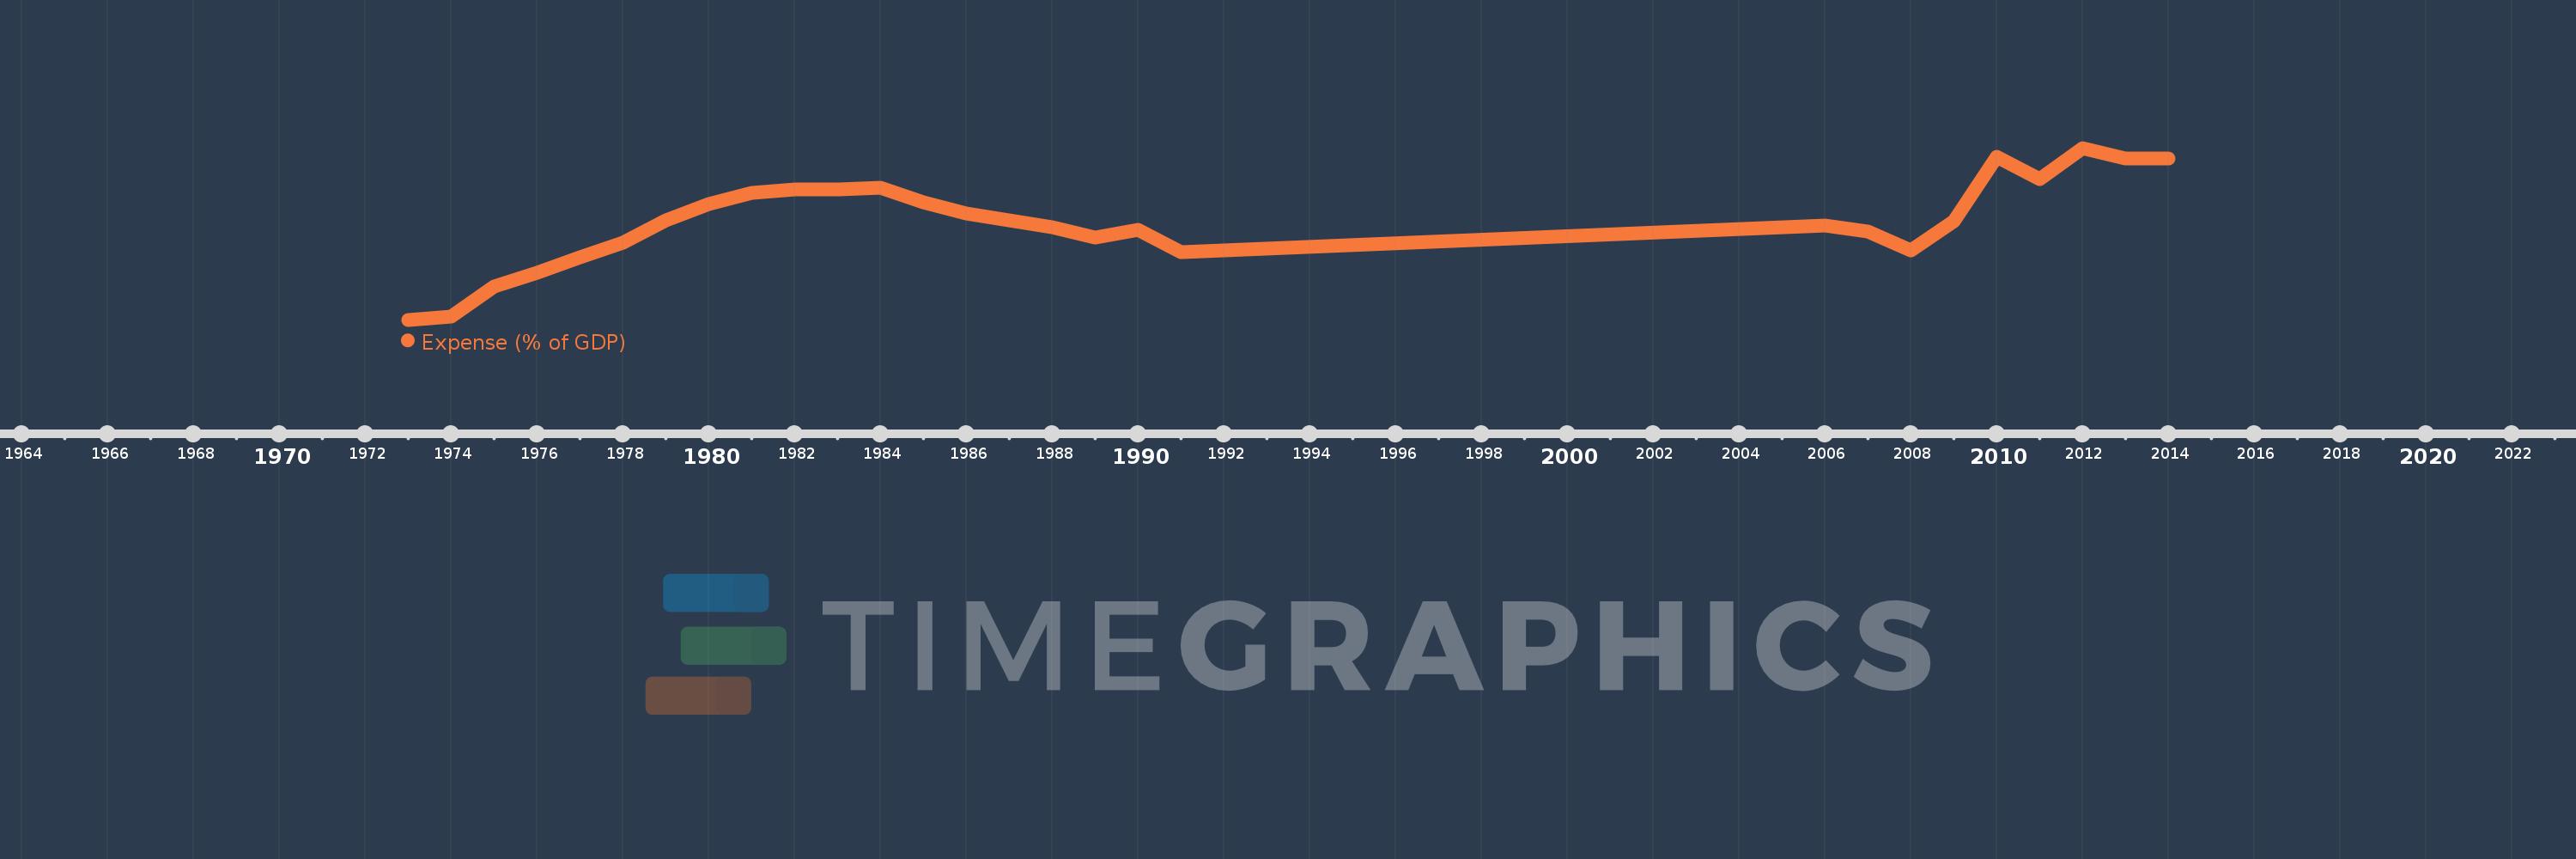
Nesta escala de tempo está apresentado um gráfico de 1973 ano até 2014 ano Japan. Dados de 1972 ano ausente. O número de observações reais por data: 28.

Fonte (nome):

Indicadores de desenvolvimento mundial

Fonte (organização):

International Monetary Fund, Government Finance Statistics Yearbook and data files, and World Bank and OECD GDP estimates.

Categorias:

Economy & Growth, Public Sector

Foi atualizado:

23 abr 2017 ano

Indicadores de alterações dos valores ao longo dos anos

Em média:
15.574
Mínimo:
11.196
1 jan 1973 ano
Máximo:
18.817
1 jan 2012 ano
Na data de observação
Valor
Mudança absoluta
A alteração em relação ao valor anterior
1 jan 1973 ano
11.196
+11.196
0.0%
1 jan 1974 ano
11.327
+0.131
1.17%
1 jan 1975 ano
12.685
+1.358
11.99%
1 jan 1976 ano
13.299
+0.613
4.84%
1 jan 1977 ano
13.957
+0.659
4.95%
1 jan 1978 ano
14.603
+0.646
4.63%
1 jan 1979 ano
15.617
+1.013
6.94%
1 jan 1980 ano
16.339
+0.723
4.63%
1 jan 1981 ano
16.828
+0.489
2.99%
1 jan 1982 ano
16.985
+0.157
0.93%
1 jan 1983 ano
16.961
-0.025
-0.14%
1 jan 1984 ano
17.041
+0.08
0.47%
1 jan 1985 ano
16.424
-0.616
-3.62%
1 jan 1986 ano
15.898
-0.526
-3.2%
1 jan 1987 ano
15.621
-0.277
-1.74%
1 jan 1988 ano
15.301
-0.32
-2.05%
1 jan 1989 ano
14.843
-0.458
-2.99%
1 jan 1990 ano
15.203
+0.36
2.43%
1 jan 1991 ano
14.213
-0.99
-6.51%
1 jan 2006 ano
15.388
+1.175
8.26%
1 jan 2007 ano
15.118
-0.269
-1.75%
1 jan 2008 ano
14.28
-0.839
-5.55%
1 jan 2009 ano
15.557
+1.278
8.95%
1 jan 2010 ano
18.411
+2.854
18.35%
1 jan 2011 ano
17.422
-0.989
-5.37%
1 jan 2012 ano
18.817
+1.395
8.01%
1 jan 2013 ano
18.367
-0.451
-2.4%
1 jan 2014 ano
18.359
-0.008
-0.04%

Classificação de países por estatísticas atuais por anos