33
/pt/
AIzaSyAYiBZKx7MnpbEhh9jyipgxe19OcubqV5w
May 1, 2025
162477
Jamaica
JAM
true
2
1
Expense (% of GDP)
2015,2014,2013,2012,2011,2010,2009,2008,2007,2006,2005,2004,2003,2002,2001,2000,1999,1998,1997,1996,1995,1994,1993,1986,1985,1984,1978,1977,1976
Download
Biblioteca de estatísticas globais →Jamaica →

Expense (% of GDP)

Estas estatísticas em outros países:

AfghanistanAlbaniaAlgeriaAngolaAntigua and BarbudaArmeniaAustraliaAustriaAzerbaijanBahamas, TheBahrainBangladeshBarbadosBelarusBelgiumBelizeBeninBhutanBoliviaBosnia and HerzegovinaBotswanaBrazilBulgariaBurkina FasoBurundiCabo VerdeCambodiaCanadaCaribbean small statesCentral African RepublicCentral Europe and the BalticsChileColombiaCongo, Dem. Rep.Congo, Rep.Costa RicaCote d'IvoireCroatiaCyprusCzech RepublicDenmarkDominicaDominican RepublicEarly-demographic dividendEgypt, Arab Rep.El SalvadorEquatorial GuineaEstoniaEthiopiaEuro areaEurope & Central AsiaEurope & Central Asia (excluding high income)Europe & Central Asia (IDA & IBRD countries)European UnionFijiFinlandFranceGambia, TheGeorgiaGermanyGhanaGreeceGrenadaGuatemalaHeavily indebted poor countries (HIPC)High incomeHondurasHong Kong SAR, ChinaHungaryIcelandIDA blendIDA onlyIDA totalIndiaIndonesiaIran, Islamic Rep.IraqIrelandIsraelItalyJamaicaJapanJordanKazakhstanKenyaKiribatiKorea, Rep.KuwaitKyrgyz RepublicLao PDRLatin America & Caribbean Latin America & Caribbean (excluding high income)Latin America & the Caribbean (IDA & IBRD countries)LatviaLeast developed countries: UN classificationLebanonLesothoLiberiaLithuaniaLow incomeLower middle incomeLuxembourgMacao SAR, ChinaMacedonia, FYRMadagascarMalawiMalaysiaMaldivesMaliMaltaMauritiusMexicoMicronesia, Fed. Sts.Middle East & North Africa (excluding high income)Middle East & North Africa (IDA & IBRD countries)MoldovaMongoliaMoroccoMozambiqueMyanmarNamibiaNepalNetherlandsNew ZealandNicaraguaNigeriaNorth AmericaNorwayOECD membersOmanOther small statesPacific island small statesPakistanPanamaPapua New GuineaParaguayPeruPhilippinesPolandPortugalPost-demographic dividendPre-demographic dividendQatarRomaniaRussian FederationRwandaSamoaSan MarinoSao Tome and PrincipeSenegalSerbiaSeychellesSierra LeoneSingaporeSlovak RepublicSloveniaSmall statesSolomon IslandsSouth AfricaSouth AsiaSouth Asia (IDA & IBRD)SpainSri LankaSt. Kitts and NevisSt. LuciaSub-Saharan Africa Sub-Saharan Africa (excluding high income)Sub-Saharan Africa (IDA & IBRD countries)SurinameSwazilandSwedenSwitzerlandSyrian Arab RepublicTajikistanTanzaniaThailandTimor-LesteTogoTrinidad and TobagoTunisiaTurkeyUgandaUkraineUnited Arab EmiratesUnited KingdomUnited StatesUruguayVanuatuVenezuela, RBVietnamWest Bank and GazaWorldYemen, Rep.ZambiaZimbabwe

Linha do tempo:

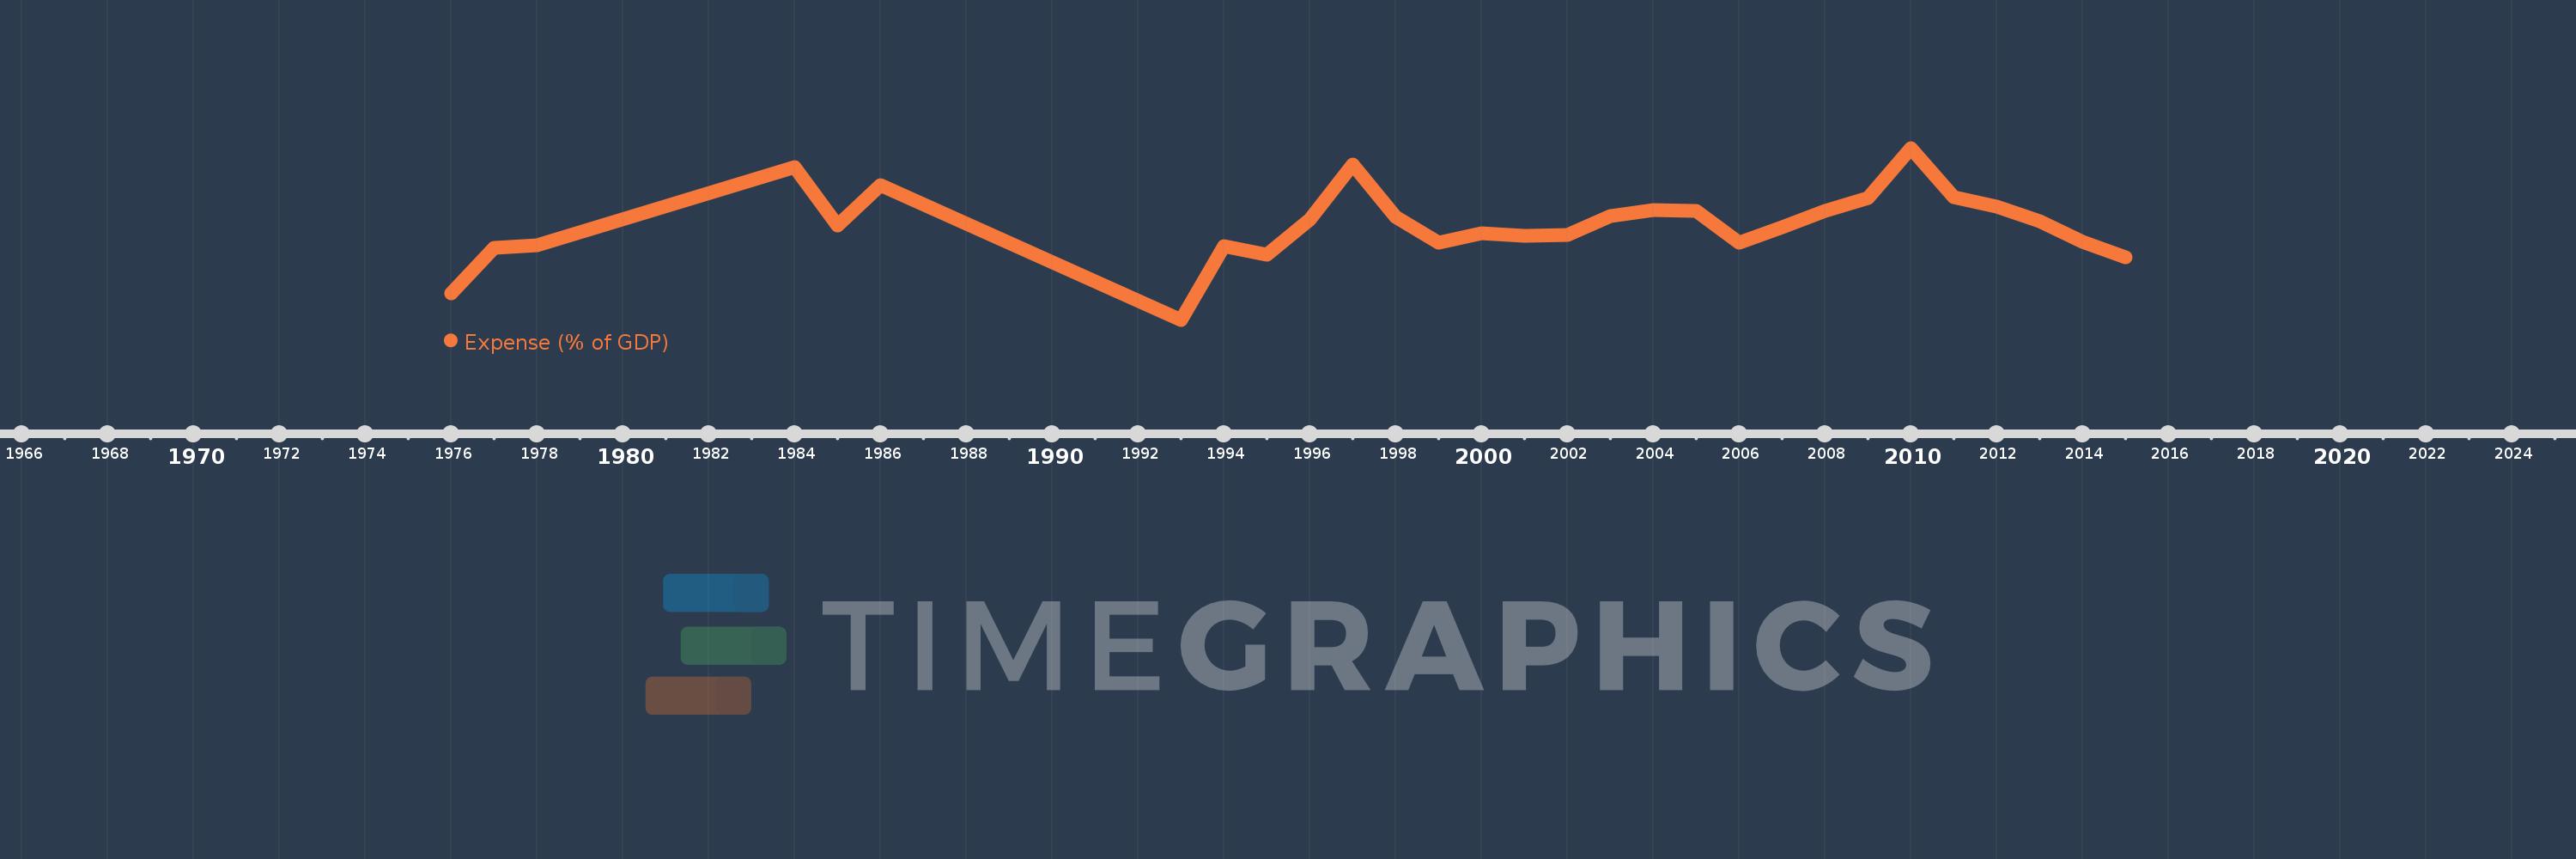
Nesta escala de tempo está apresentado um gráfico de 1976 ano até 2015 ano Jamaica. Dados de 1975 ano ausente. O número de observações reais por data: 29.

Fonte (nome):

Indicadores de desenvolvimento mundial

Fonte (organização):

International Monetary Fund, Government Finance Statistics Yearbook and data files, and World Bank and OECD GDP estimates.

Categorias:

Economy & Growth, Public Sector

Foi atualizado:

23 abr 2017 ano

Indicadores de alterações dos valores ao longo dos anos

Em média:
32.72
Mínimo:
22.246
1 jan 1993 ano
Máximo:
41.216
1 jan 2010 ano
Na data de observação
Valor
Mudança absoluta
A alteração em relação ao valor anterior
1 jan 1976 ano
25.162
+25.162
0.0%
1 jan 1977 ano
30.144
+4.982
19.8%
1 jan 1978 ano
30.437
+0.293
0.97%
1 jan 1984 ano
39.109
+8.672
28.49%
1 jan 1985 ano
32.665
-6.444
-16.48%
1 jan 1986 ano
37.139
+4.473
13.69%
1 jan 1993 ano
22.246
-14.893
-40.1%
1 jan 1994 ano
30.415
+8.169
36.72%
1 jan 1995 ano
29.408
-1.007
-3.31%
1 jan 1996 ano
33.274
+3.866
13.15%
1 jan 1997 ano
39.394
+6.12
18.39%
1 jan 1998 ano
33.578
-5.816
-14.76%
1 jan 1999 ano
30.786
-2.792
-8.31%
1 jan 2000 ano
31.754
+0.968
3.14%
1 jan 2001 ano
31.513
-0.241
-0.76%
1 jan 2002 ano
31.617
+0.104
0.33%
1 jan 2003 ano
33.648
+2.031
6.43%
1 jan 2004 ano
34.344
+0.696
2.07%
1 jan 2005 ano
34.296
-0.049
-0.14%
1 jan 2006 ano
30.763
-3.533
-10.3%
1 jan 2007 ano
32.473
+1.71
5.56%
1 jan 2008 ano
34.251
+1.778
5.47%
1 jan 2009 ano
35.639
+1.389
4.05%
1 jan 2010 ano
41.216
+5.577
15.65%
1 jan 2011 ano
35.778
-5.438
-13.19%
1 jan 2012 ano
34.784
-0.994
-2.78%
1 jan 2013 ano
33.118
-1.667
-4.79%
1 jan 2014 ano
30.825
-2.292
-6.92%
1 jan 2015 ano
29.116
-1.71
-5.55%

Classificação de países por estatísticas atuais por anos