33
/pt/
AIzaSyAYiBZKx7MnpbEhh9jyipgxe19OcubqV5w
August 1, 2025
248632
Sri Lanka
LKA
true
2
1
Expense (% of GDP)
2015,2014,2013,2012,2011,2010,2009,2008,2007,2006,2005,2004,2003,2002,2001,2000,1999,1998,1997,1996,1995,1994,1993,1992,1991
Download
Biblioteca de estatísticas globais →Sri Lanka →

Expense (% of GDP)

Estas estatísticas em outros países:

AfghanistanAlbaniaAlgeriaAngolaAntigua and BarbudaArmeniaAustraliaAustriaAzerbaijanBahamas, TheBahrainBangladeshBarbadosBelarusBelgiumBelizeBeninBhutanBoliviaBosnia and HerzegovinaBotswanaBrazilBulgariaBurkina FasoBurundiCabo VerdeCambodiaCanadaCaribbean small statesCentral African RepublicCentral Europe and the BalticsChileColombiaCongo, Dem. Rep.Congo, Rep.Costa RicaCote d'IvoireCroatiaCyprusCzech RepublicDenmarkDominicaDominican RepublicEarly-demographic dividendEgypt, Arab Rep.El SalvadorEquatorial GuineaEstoniaEthiopiaEuro areaEurope & Central AsiaEurope & Central Asia (excluding high income)Europe & Central Asia (IDA & IBRD countries)European UnionFijiFinlandFranceGambia, TheGeorgiaGermanyGhanaGreeceGrenadaGuatemalaHeavily indebted poor countries (HIPC)High incomeHondurasHong Kong SAR, ChinaHungaryIcelandIDA blendIDA onlyIDA totalIndiaIndonesiaIran, Islamic Rep.IraqIrelandIsraelItalyJamaicaJapanJordanKazakhstanKenyaKiribatiKorea, Rep.KuwaitKyrgyz RepublicLao PDRLatin America & Caribbean Latin America & Caribbean (excluding high income)Latin America & the Caribbean (IDA & IBRD countries)LatviaLeast developed countries: UN classificationLebanonLesothoLiberiaLithuaniaLow incomeLower middle incomeLuxembourgMacao SAR, ChinaMacedonia, FYRMadagascarMalawiMalaysiaMaldivesMaliMaltaMauritiusMexicoMicronesia, Fed. Sts.Middle East & North Africa (excluding high income)Middle East & North Africa (IDA & IBRD countries)MoldovaMongoliaMoroccoMozambiqueMyanmarNamibiaNepalNetherlandsNew ZealandNicaraguaNigeriaNorth AmericaNorwayOECD membersOmanOther small statesPacific island small statesPakistanPanamaPapua New GuineaParaguayPeruPhilippinesPolandPortugalPost-demographic dividendPre-demographic dividendQatarRomaniaRussian FederationRwandaSamoaSan MarinoSao Tome and PrincipeSenegalSerbiaSeychellesSierra LeoneSingaporeSlovak RepublicSloveniaSmall statesSolomon IslandsSouth AfricaSouth AsiaSouth Asia (IDA & IBRD)SpainSri LankaSt. Kitts and NevisSt. LuciaSub-Saharan Africa Sub-Saharan Africa (excluding high income)Sub-Saharan Africa (IDA & IBRD countries)SurinameSwazilandSwedenSwitzerlandSyrian Arab RepublicTajikistanTanzaniaThailandTimor-LesteTogoTrinidad and TobagoTunisiaTurkeyUgandaUkraineUnited Arab EmiratesUnited KingdomUnited StatesUruguayVanuatuVenezuela, RBVietnamWest Bank and GazaWorldYemen, Rep.ZambiaZimbabwe

Linha do tempo:

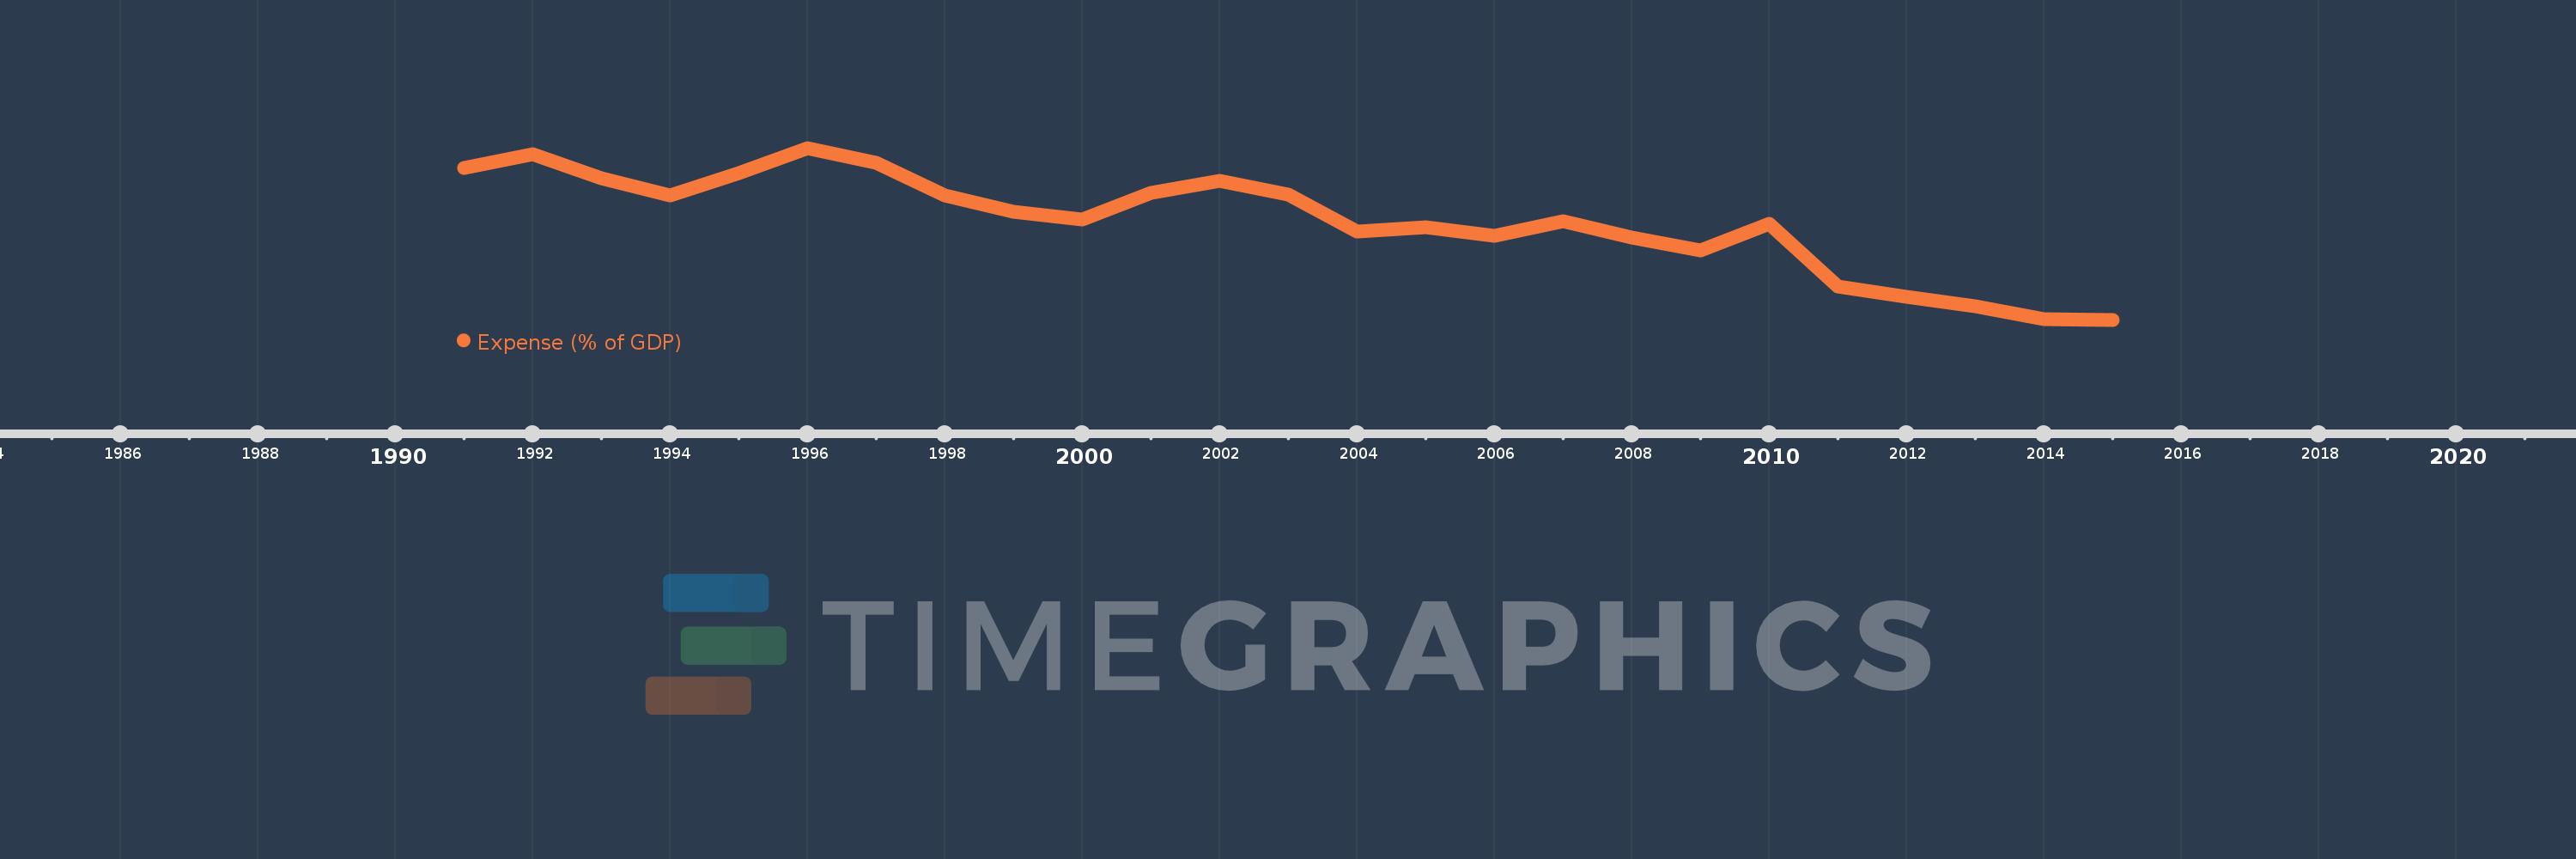
Nesta escala de tempo está apresentado um gráfico de 1991 ano até 2015 ano Sri Lanka. Dados de 1990 ano ausente. O número de observações reais por data: 25.

Fonte (nome):

Indicadores de desenvolvimento mundial

Fonte (organização):

International Monetary Fund, Government Finance Statistics Yearbook and data files, and World Bank and OECD GDP estimates.

Categorias:

Economy & Growth, Public Sector

Foi atualizado:

23 abr 2017 ano

Indicadores de alterações dos valores ao longo dos anos

Em média:
21.132
Mínimo:
14.648
1 jan 2015 ano
Máximo:
25.951
1 jan 1996 ano
Na data de observação
Valor
Mudança absoluta
A alteração em relação ao valor anterior
1 jan 1991 ano
24.636
+24.636
0.0%
1 jan 1992 ano
25.511
+0.875
3.55%
1 jan 1993 ano
23.98
-1.531
-6.0%
1 jan 1994 ano
22.839
-1.141
-4.76%
1 jan 1995 ano
24.302
+1.463
6.41%
1 jan 1996 ano
25.951
+1.649
6.78%
1 jan 1997 ano
24.976
-0.975
-3.76%
1 jan 1998 ano
22.832
-2.145
-8.59%
1 jan 1999 ano
21.765
-1.067
-4.67%
1 jan 2000 ano
21.219
-0.546
-2.51%
1 jan 2001 ano
22.989
+1.769
8.34%
1 jan 2002 ano
23.813
+0.825
3.59%
1 jan 2003 ano
22.907
-0.906
-3.81%
1 jan 2004 ano
20.478
-2.429
-10.6%
1 jan 2005 ano
20.711
+0.233
1.14%
1 jan 2006 ano
20.196
-0.515
-2.49%
1 jan 2007 ano
21.148
+0.952
4.71%
1 jan 2008 ano
20.047
-1.101
-5.21%
1 jan 2009 ano
19.212
-0.835
-4.16%
1 jan 2010 ano
20.958
+1.747
9.09%
1 jan 2011 ano
16.85
-4.109
-19.6%
1 jan 2012 ano
16.166
-0.684
-4.06%
1 jan 2013 ano
15.512
-0.654
-4.05%
1 jan 2014 ano
14.668
-0.844
-5.44%
1 jan 2015 ano
14.648
-0.02
-0.14%

Classificação de países por estatísticas atuais por anos