33
/pt/
AIzaSyAYiBZKx7MnpbEhh9jyipgxe19OcubqV5w
August 1, 2025
207218
Nepal
NPL
true
2
1
Percentage of male teachers in primary education who are trained, male (%)
2016,2015,2014,2013,2012,2011,2009,2008,2006,2005,2004,2003,2002,2000
Download
Biblioteca de estatísticas globais →Nepal →

Percentage of male teachers in primary education who are trained, male (%)

Estas estatísticas em outros países:

AlgeriaAndorraAngolaAntigua and BarbudaArab WorldArmeniaArubaAzerbaijanBahamas, TheBahrainBangladeshBarbadosBelarusBelizeBeninBermudaBhutanBoliviaBotswanaBritish Virgin IslandsBrunei DarussalamBurkina FasoBurundiCabo VerdeCambodiaCameroonCaribbean small statesCayman IslandsCentral African RepublicColombiaComorosCongo, Dem. Rep.Congo, Rep.Costa RicaCote d'IvoireCroatiaCubaDjiboutiDominicaDominican RepublicEcuadorEgypt, Arab Rep.El SalvadorEquatorial GuineaEritreaEthiopiaFijiFragile and conflict affected situationsGabonGambia, TheGeorgiaGhanaGibraltarGrenadaGuineaGuinea-BissauGuyanaHeavily indebted poor countries (HIPC)HondurasHong Kong SAR, ChinaIDA blendIDA onlyIDA totalIran, Islamic Rep.IraqJamaicaKazakhstanKenyaKiribatiKuwaitKyrgyz RepublicLao PDRLeast developed countries: UN classificationLebanonLesothoLiberiaLow incomeMacao SAR, ChinaMadagascarMalawiMalaysiaMaldivesMaliMauritaniaMauritiusMiddle East & North AfricaMiddle East & North Africa (excluding high income)Middle East & North Africa (IDA & IBRD countries)MoldovaMongoliaMoroccoMozambiqueMyanmarNamibiaNauruNepalNicaraguaNigerNigeriaOmanOther small statesPacific island small statesPakistanPanamaParaguayPhilippinesPre-demographic dividendQatarRwandaSao Tome and PrincipeSaudi ArabiaSenegalSerbiaSeychellesSierra LeoneSingaporeSmall statesSolomon IslandsSouth AfricaSt. Kitts and NevisSt. LuciaSt. Vincent and the GrenadinesSub-Saharan Africa Sub-Saharan Africa (excluding high income)Sub-Saharan Africa (IDA & IBRD countries)SurinameSwazilandSyrian Arab RepublicTajikistanTanzaniaTogoTongaTrinidad and TobagoTunisiaTurks and Caicos IslandsUgandaUnited Arab EmiratesUzbekistanVietnamWest Bank and GazaZambiaZimbabwe

Linha do tempo:

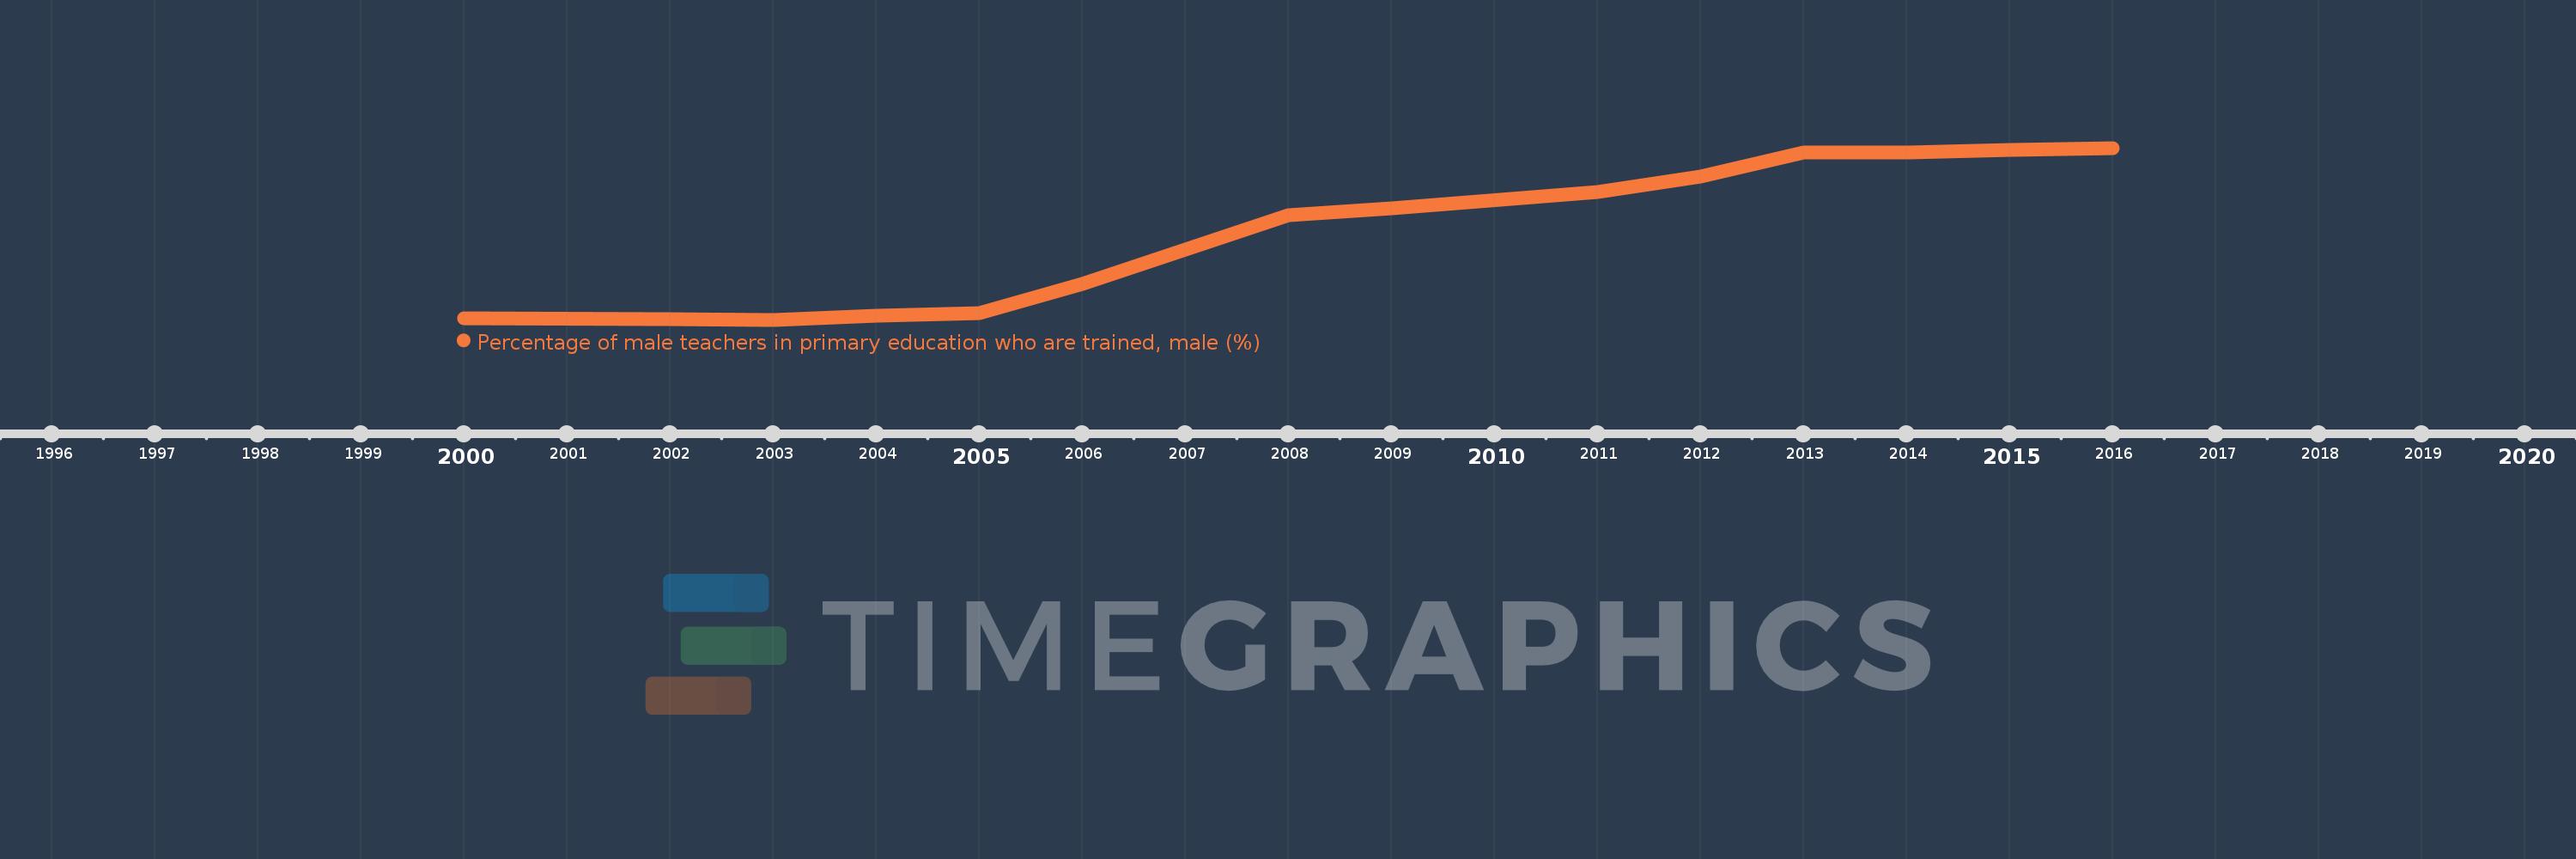
Nesta escala de tempo está apresentado um gráfico de 2000 ano até 2016 ano Nepal. Dados de 1999 ano ausente. O número de observações reais por data: 14.

Fonte (nome):

Indicadores de desenvolvimento mundial

Fonte (organização):

United Nations Educational, Scientific, and Cultural Organization (UNESCO) Institute for Statistics.

Categorias:

Education, Gender

Foi atualizado:

23 abr 2017 ano

Indicadores de alterações dos valores ao longo dos anos

Em média:
55.373
Mínimo:
15.508
1 jan 2003 ano
Máximo:
94.641
1 jan 2016 ano
Na data de observação
Valor
Mudança absoluta
A alteração em relação ao valor anterior
1 jan 2000 ano
16.105
+16.105
0.0%
1 jan 2002 ano
15.98
-0.125
-0.77%
1 jan 2003 ano
15.508
-0.472
-2.95%
1 jan 2004 ano
17.324
+1.816
11.71%
1 jan 2005 ano
18.455
+1.131
6.53%
1 jan 2006 ano
32.008
+13.553
73.44%
1 jan 2008 ano
63.489
+31.48
98.35%
1 jan 2009 ano
66.841
+3.353
5.28%
1 jan 2011 ano
74.458
+7.616
11.39%
1 jan 2012 ano
81.37
+6.913
9.28%
1 jan 2013 ano
92.738
+11.368
13.97%
1 jan 2014 ano
92.38
-0.358
-0.39%
1 jan 2015 ano
93.928
+1.548
1.68%
1 jan 2016 ano
94.641
+0.714
0.76%

Classificação de países por estatísticas atuais por anos