33
/pt/
AIzaSyAYiBZKx7MnpbEhh9jyipgxe19OcubqV5w
August 1, 2025
189409
Maldives
MDV
true
2
1
Percentage of male teachers in primary education who are trained, male (%)
2015,2014,2013,2012,2011,2010,2009,2008,2007,2006,2004,2003,2002,2001,2000,1999
Download
Biblioteca de estatísticas globais →Maldives →

Percentage of male teachers in primary education who are trained, male (%)

Estas estatísticas em outros países:

AlgeriaAndorraAngolaAntigua and BarbudaArab WorldArmeniaArubaAzerbaijanBahamas, TheBahrainBangladeshBarbadosBelarusBelizeBeninBermudaBhutanBoliviaBotswanaBritish Virgin IslandsBrunei DarussalamBurkina FasoBurundiCabo VerdeCambodiaCameroonCaribbean small statesCayman IslandsCentral African RepublicColombiaComorosCongo, Dem. Rep.Congo, Rep.Costa RicaCote d'IvoireCroatiaCubaDjiboutiDominicaDominican RepublicEcuadorEgypt, Arab Rep.El SalvadorEquatorial GuineaEritreaEthiopiaFijiFragile and conflict affected situationsGabonGambia, TheGeorgiaGhanaGibraltarGrenadaGuineaGuinea-BissauGuyanaHeavily indebted poor countries (HIPC)HondurasHong Kong SAR, ChinaIDA blendIDA onlyIDA totalIran, Islamic Rep.IraqJamaicaKazakhstanKenyaKiribatiKuwaitKyrgyz RepublicLao PDRLeast developed countries: UN classificationLebanonLesothoLiberiaLow incomeMacao SAR, ChinaMadagascarMalawiMalaysiaMaldivesMaliMauritaniaMauritiusMiddle East & North AfricaMiddle East & North Africa (excluding high income)Middle East & North Africa (IDA & IBRD countries)MoldovaMongoliaMoroccoMozambiqueMyanmarNamibiaNauruNepalNicaraguaNigerNigeriaOmanOther small statesPacific island small statesPakistanPanamaParaguayPhilippinesPre-demographic dividendQatarRwandaSao Tome and PrincipeSaudi ArabiaSenegalSerbiaSeychellesSierra LeoneSingaporeSmall statesSolomon IslandsSouth AfricaSt. Kitts and NevisSt. LuciaSt. Vincent and the GrenadinesSub-Saharan Africa Sub-Saharan Africa (excluding high income)Sub-Saharan Africa (IDA & IBRD countries)SurinameSwazilandSyrian Arab RepublicTajikistanTanzaniaTogoTongaTrinidad and TobagoTunisiaTurks and Caicos IslandsUgandaUnited Arab EmiratesUzbekistanVietnamWest Bank and GazaZambiaZimbabwe

Linha do tempo:

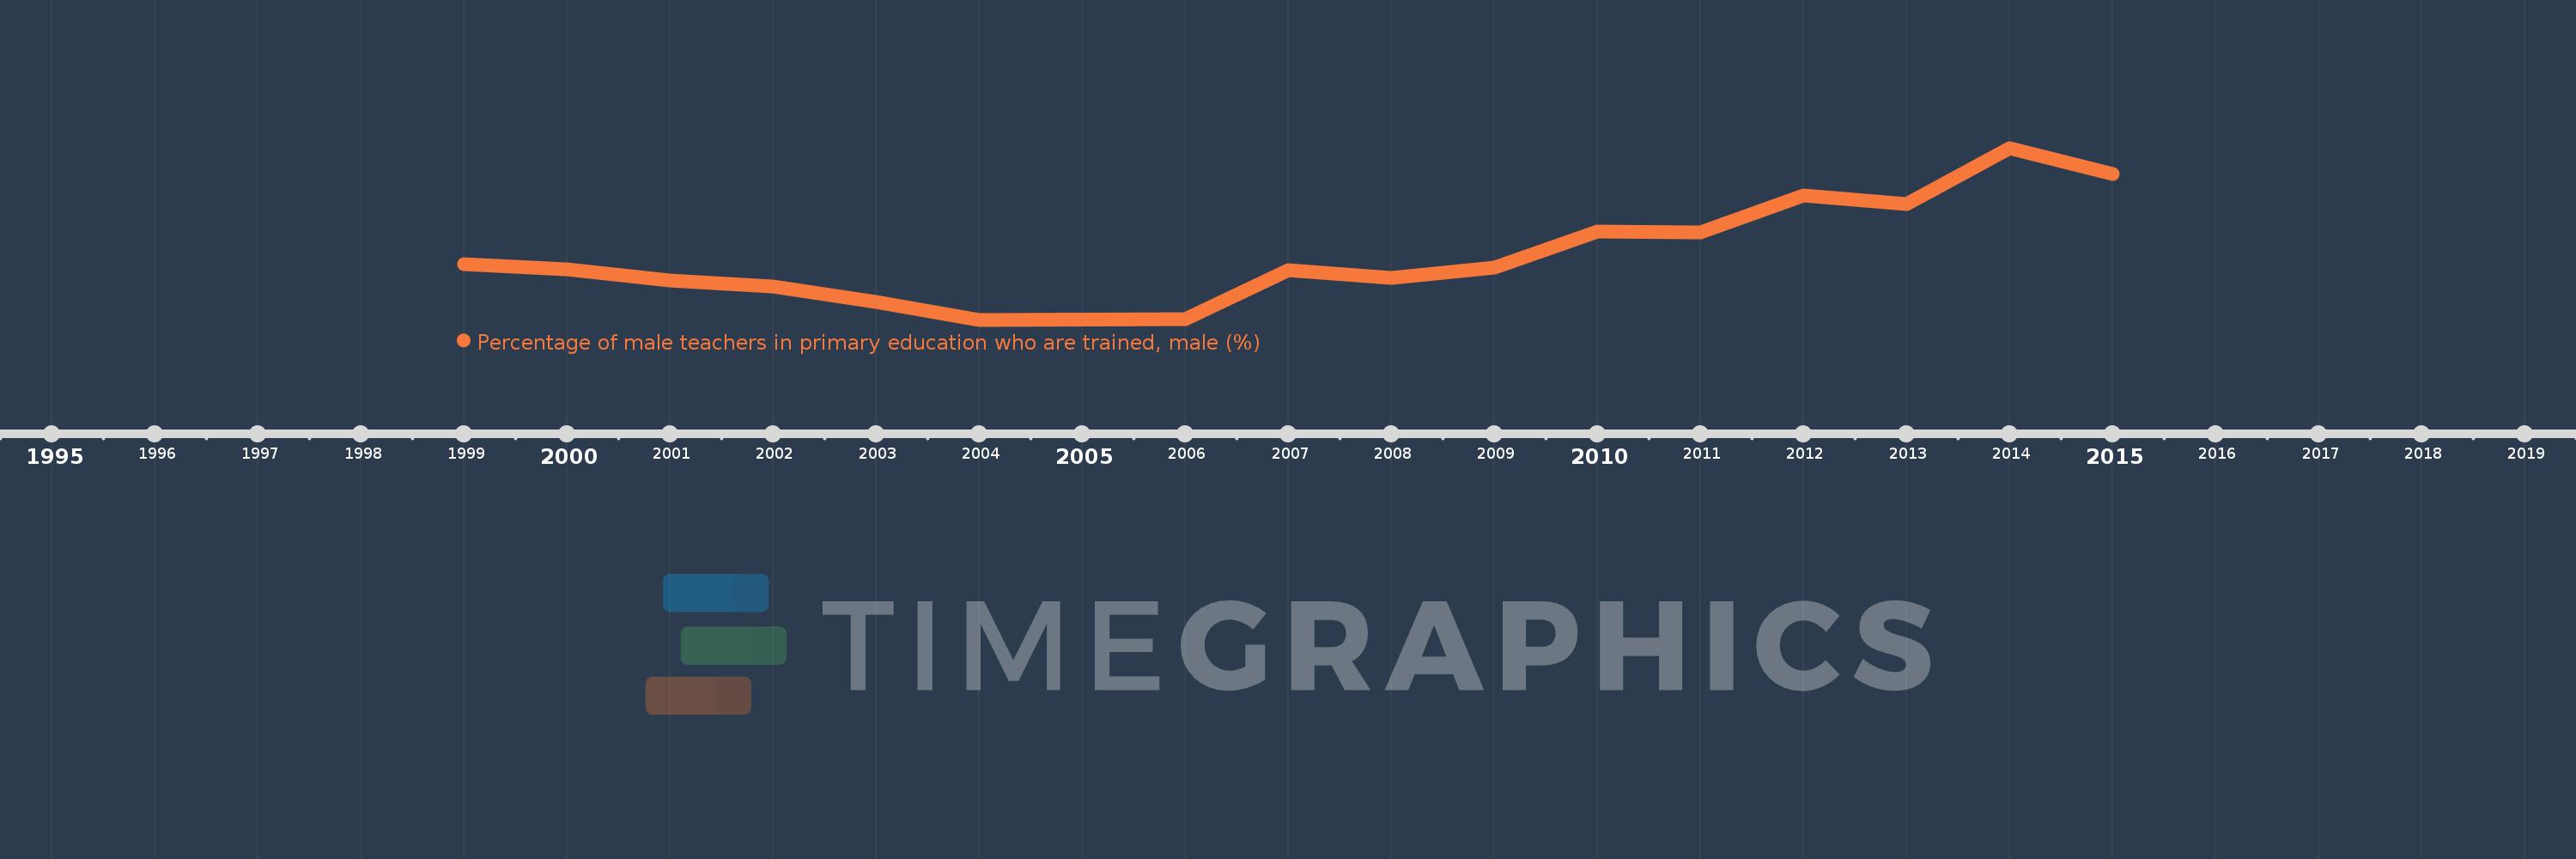
Nesta escala de tempo está apresentado um gráfico de 1999 ano até 2015 ano Maldives. Dados de 1998 ano ausente. O número de observações reais por data: 16.

Fonte (nome):

Indicadores de desenvolvimento mundial

Fonte (organização):

United Nations Educational, Scientific, and Cultural Organization (UNESCO) Institute for Statistics.

Categorias:

Education, Gender

Foi atualizado:

23 abr 2017 ano

Indicadores de alterações dos valores ao longo dos anos

Em média:
72.941
Mínimo:
60.362
1 jan 2004 ano
Máximo:
92.625
1 jan 2014 ano
Na data de observação
Valor
Mudança absoluta
A alteração em relação ao valor anterior
1 jan 1999 ano
70.769
+70.769
0.0%
1 jan 2000 ano
69.862
-0.907
-1.28%
1 jan 2001 ano
67.677
-2.185
-3.13%
1 jan 2002 ano
66.532
-1.145
-1.69%
1 jan 2003 ano
63.658
-2.874
-4.32%
1 jan 2004 ano
60.362
-3.296
-5.18%
1 jan 2006 ano
60.432
+0.07
0.12%
1 jan 2007 ano
69.73
+9.299
15.39%
1 jan 2008 ano
68.232
-1.498
-2.15%
1 jan 2009 ano
70.08
+1.849
2.71%
1 jan 2010 ano
76.849
+6.769
9.66%
1 jan 2011 ano
76.795
-0.054
-0.07%
1 jan 2012 ano
83.624
+6.829
8.89%
1 jan 2013 ano
82.032
-1.592
-1.9%
1 jan 2014 ano
92.625
+10.593
12.91%
1 jan 2015 ano
87.799
-4.826
-5.21%

Classificação de países por estatísticas atuais por anos