33
/pt/
AIzaSyAYiBZKx7MnpbEhh9jyipgxe19OcubqV5w
August 1, 2025
140857
Ghana
GHA
true
2
1
Percentage of male teachers in primary education who are trained, male (%)
2016,2015,2014,2013,2012,2010,2009,2008,2006,2005,2004,2003,2002,2001,2000
Download
Biblioteca de estatísticas globais →Ghana →

Percentage of male teachers in primary education who are trained, male (%)

Estas estatísticas em outros países:

AlgeriaAndorraAngolaAntigua and BarbudaArab WorldArmeniaArubaAzerbaijanBahamas, TheBahrainBangladeshBarbadosBelarusBelizeBeninBermudaBhutanBoliviaBotswanaBritish Virgin IslandsBrunei DarussalamBurkina FasoBurundiCabo VerdeCambodiaCameroonCaribbean small statesCayman IslandsCentral African RepublicColombiaComorosCongo, Dem. Rep.Congo, Rep.Costa RicaCote d'IvoireCroatiaCubaDjiboutiDominicaDominican RepublicEcuadorEgypt, Arab Rep.El SalvadorEquatorial GuineaEritreaEthiopiaFijiFragile and conflict affected situationsGabonGambia, TheGeorgiaGhanaGibraltarGrenadaGuineaGuinea-BissauGuyanaHeavily indebted poor countries (HIPC)HondurasHong Kong SAR, ChinaIDA blendIDA onlyIDA totalIran, Islamic Rep.IraqJamaicaKazakhstanKenyaKiribatiKuwaitKyrgyz RepublicLao PDRLeast developed countries: UN classificationLebanonLesothoLiberiaLow incomeMacao SAR, ChinaMadagascarMalawiMalaysiaMaldivesMaliMauritaniaMauritiusMiddle East & North AfricaMiddle East & North Africa (excluding high income)Middle East & North Africa (IDA & IBRD countries)MoldovaMongoliaMoroccoMozambiqueMyanmarNamibiaNauruNepalNicaraguaNigerNigeriaOmanOther small statesPacific island small statesPakistanPanamaParaguayPhilippinesPre-demographic dividendQatarRwandaSao Tome and PrincipeSaudi ArabiaSenegalSerbiaSeychellesSierra LeoneSingaporeSmall statesSolomon IslandsSouth AfricaSt. Kitts and NevisSt. LuciaSt. Vincent and the GrenadinesSub-Saharan Africa Sub-Saharan Africa (excluding high income)Sub-Saharan Africa (IDA & IBRD countries)SurinameSwazilandSyrian Arab RepublicTajikistanTanzaniaTogoTongaTrinidad and TobagoTunisiaTurks and Caicos IslandsUgandaUnited Arab EmiratesUzbekistanVietnamWest Bank and GazaZambiaZimbabwe

Linha do tempo:

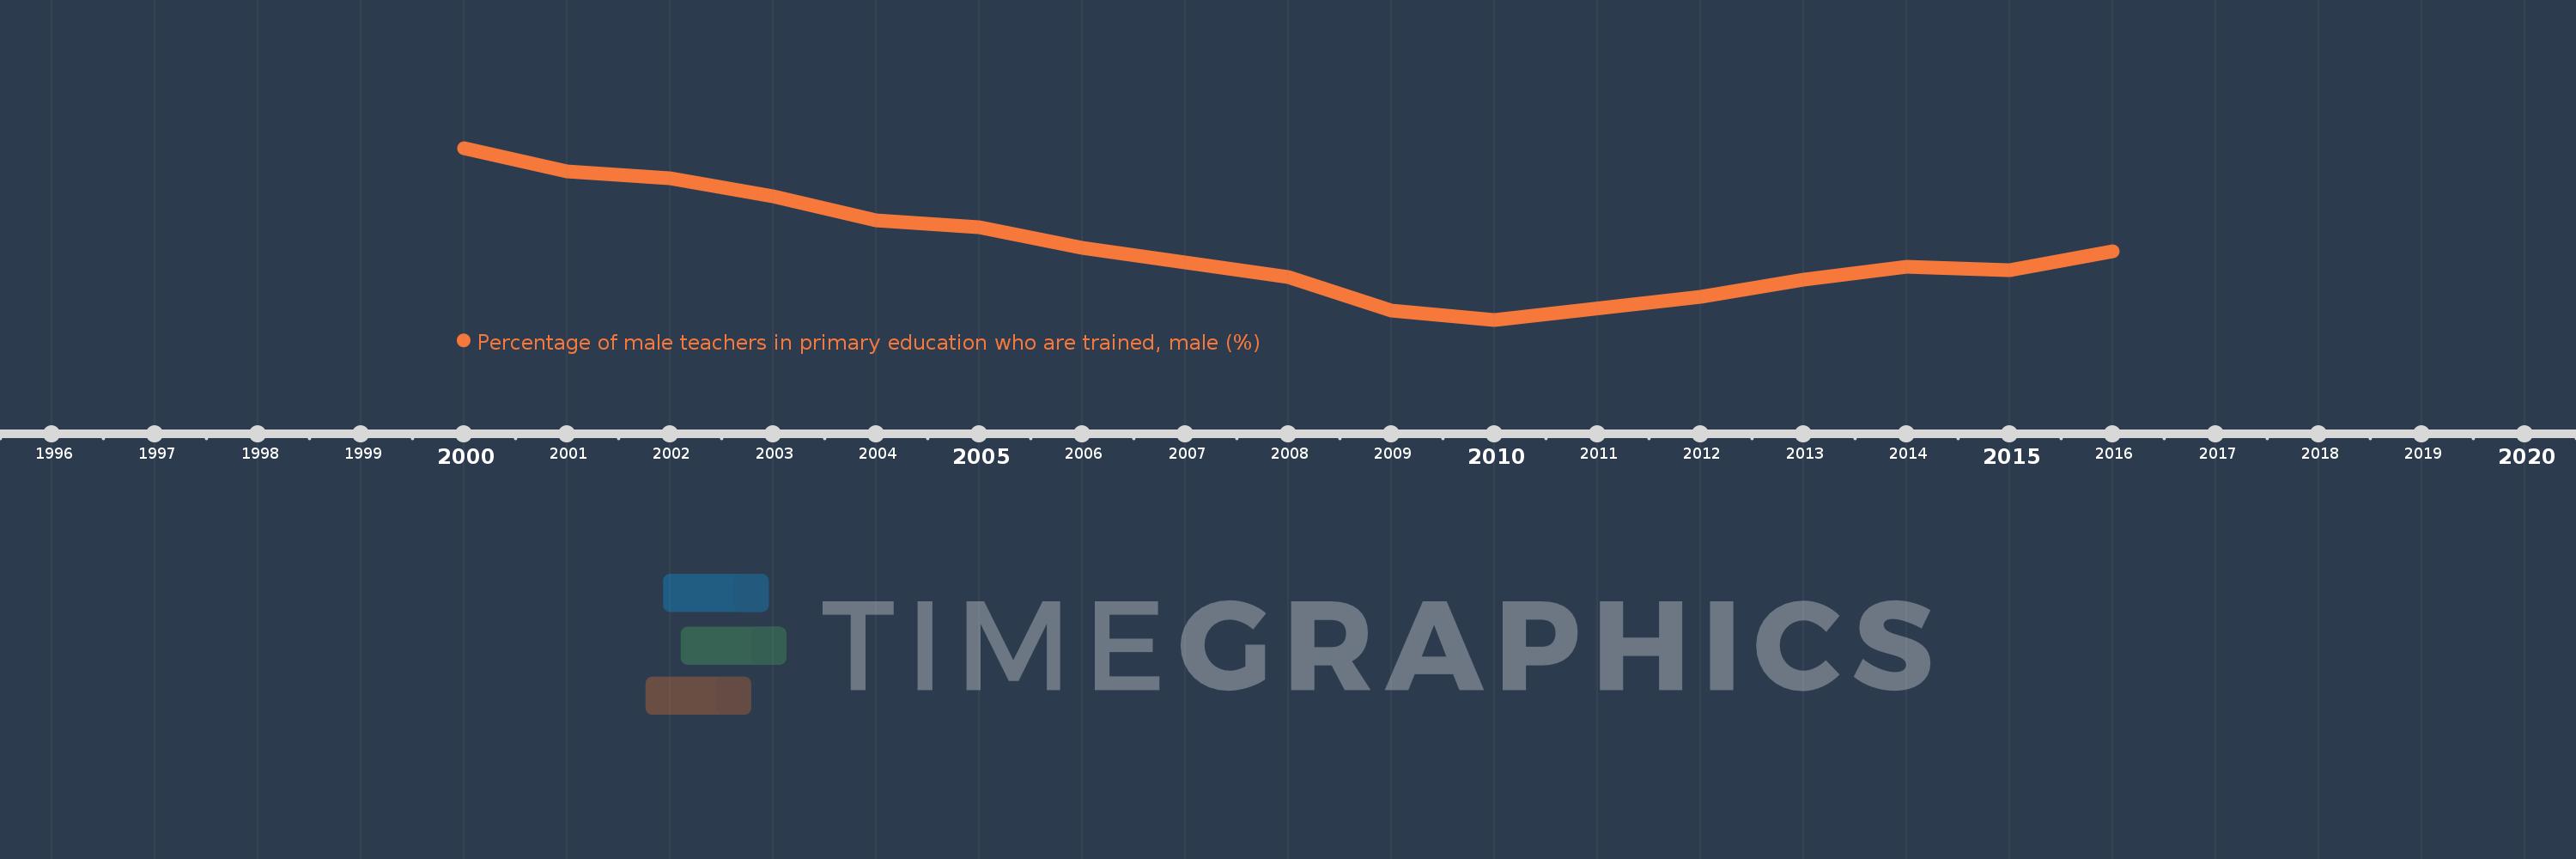
Nesta escala de tempo está apresentado um gráfico de 2000 ano até 2016 ano Ghana. Dados de 1999 ano ausente. O número de observações reais por data: 15.

Fonte (nome):

Indicadores de desenvolvimento mundial

Fonte (organização):

United Nations Educational, Scientific, and Cultural Organization (UNESCO) Institute for Statistics.

Categorias:

Education, Gender

Foi atualizado:

23 abr 2017 ano

Indicadores de alterações dos valores ao longo dos anos

Em média:
49.497
Mínimo:
38.087
1 jan 2010 ano
Máximo:
64.005
1 jan 2000 ano
Na data de observação
Valor
Mudança absoluta
A alteração em relação ao valor anterior
1 jan 2000 ano
64.005
+64.005
0.0%
1 jan 2001 ano
60.462
-3.542
-5.53%
1 jan 2002 ano
59.37
-1.092
-1.81%
1 jan 2003 ano
56.663
-2.707
-4.56%
1 jan 2004 ano
53.134
-3.529
-6.23%
1 jan 2005 ano
52.106
-1.028
-1.94%
1 jan 2006 ano
48.903
-3.203
-6.15%
1 jan 2008 ano
44.523
-4.38
-8.96%
1 jan 2009 ano
39.519
-5.003
-11.24%
1 jan 2010 ano
38.087
-1.433
-3.62%
1 jan 2012 ano
41.56
+3.473
9.12%
1 jan 2013 ano
44.199
+2.639
6.35%
1 jan 2014 ano
46.065
+1.865
4.22%
1 jan 2015 ano
45.509
-0.556
-1.21%
1 jan 2016 ano
48.353
+2.844
6.25%

Classificação de países por estatísticas atuais por anos