33
/pt/
AIzaSyB4mHJ5NPEv-XzF7P6NDYXjlkCWaeKw5bc
November 1, 2025
172148
Kuwait
KWT
true
2
1
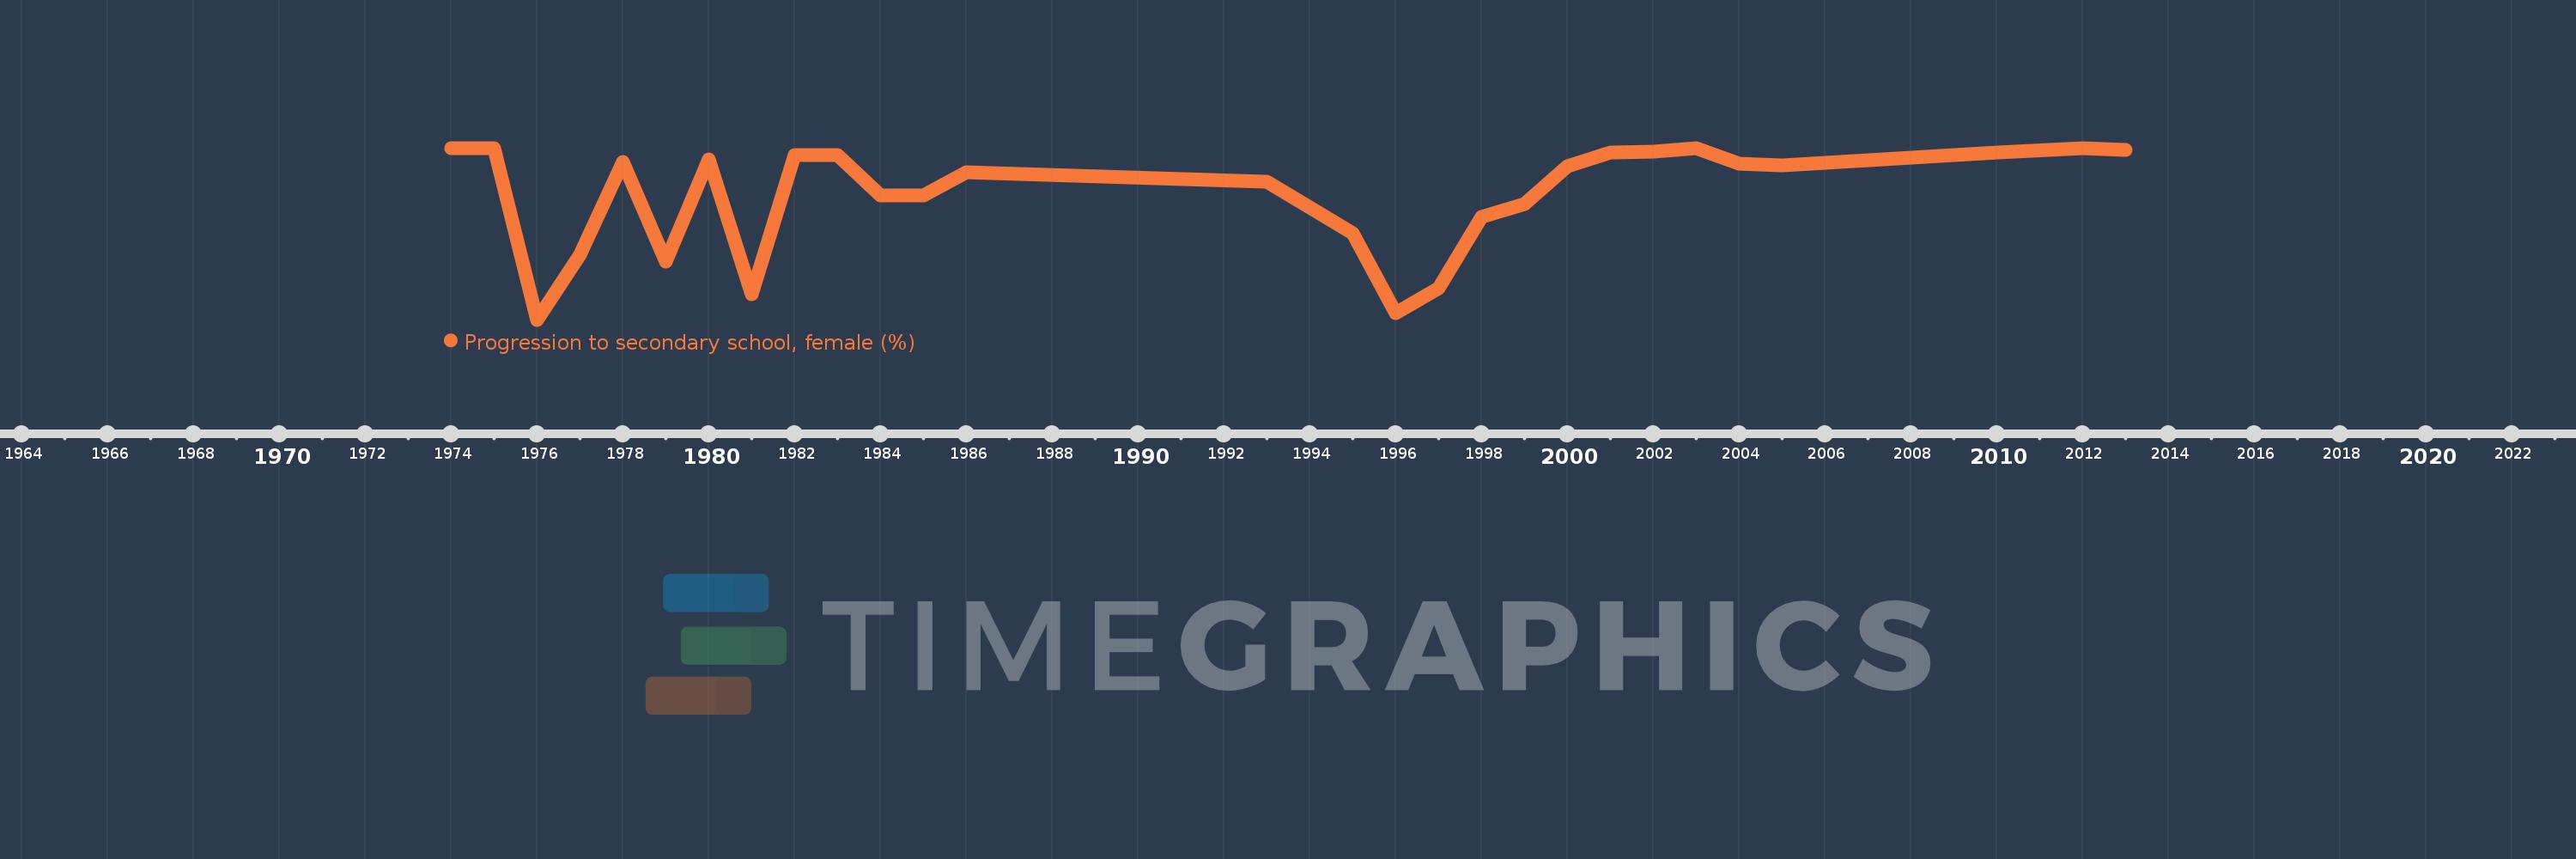
Progression to secondary school, female (%)
2013,2012,2010,2005,2004,2003,2002,2001,2000,1999,1998,1997,1996,1995,1993,1986,1985,1984,1983,1982,1981,1980,1979,1978,1977,1976,1975,1974