33
/pt/
AIzaSyB4mHJ5NPEv-XzF7P6NDYXjlkCWaeKw5bc
November 30, 2025
142253
Greece
GRC
true
2
1
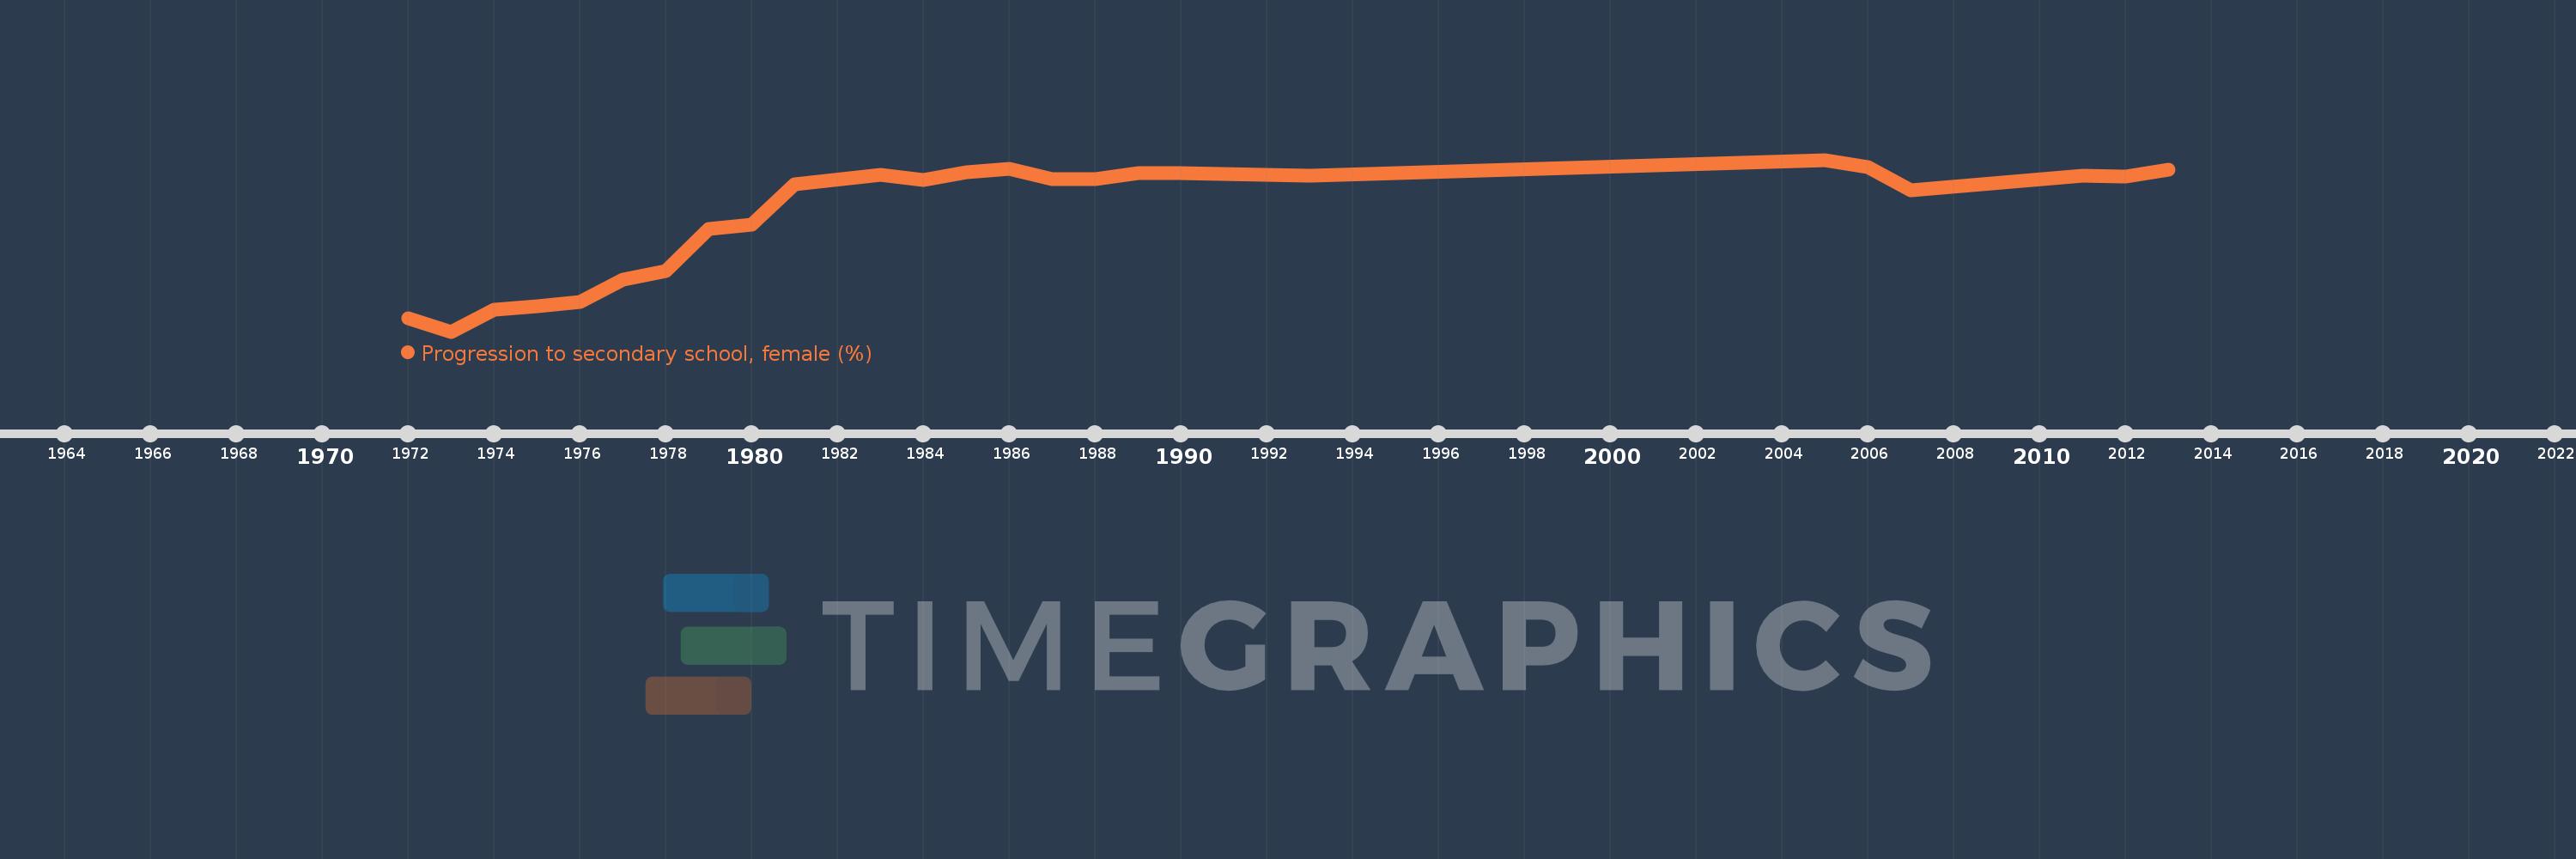
Progression to secondary school, female (%)
2013,2012,2011,2007,2006,2005,1993,1990,1989,1988,1987,1986,1985,1984,1983,1981,1980,1979,1978,1977,1976,1975,1974,1973,1972